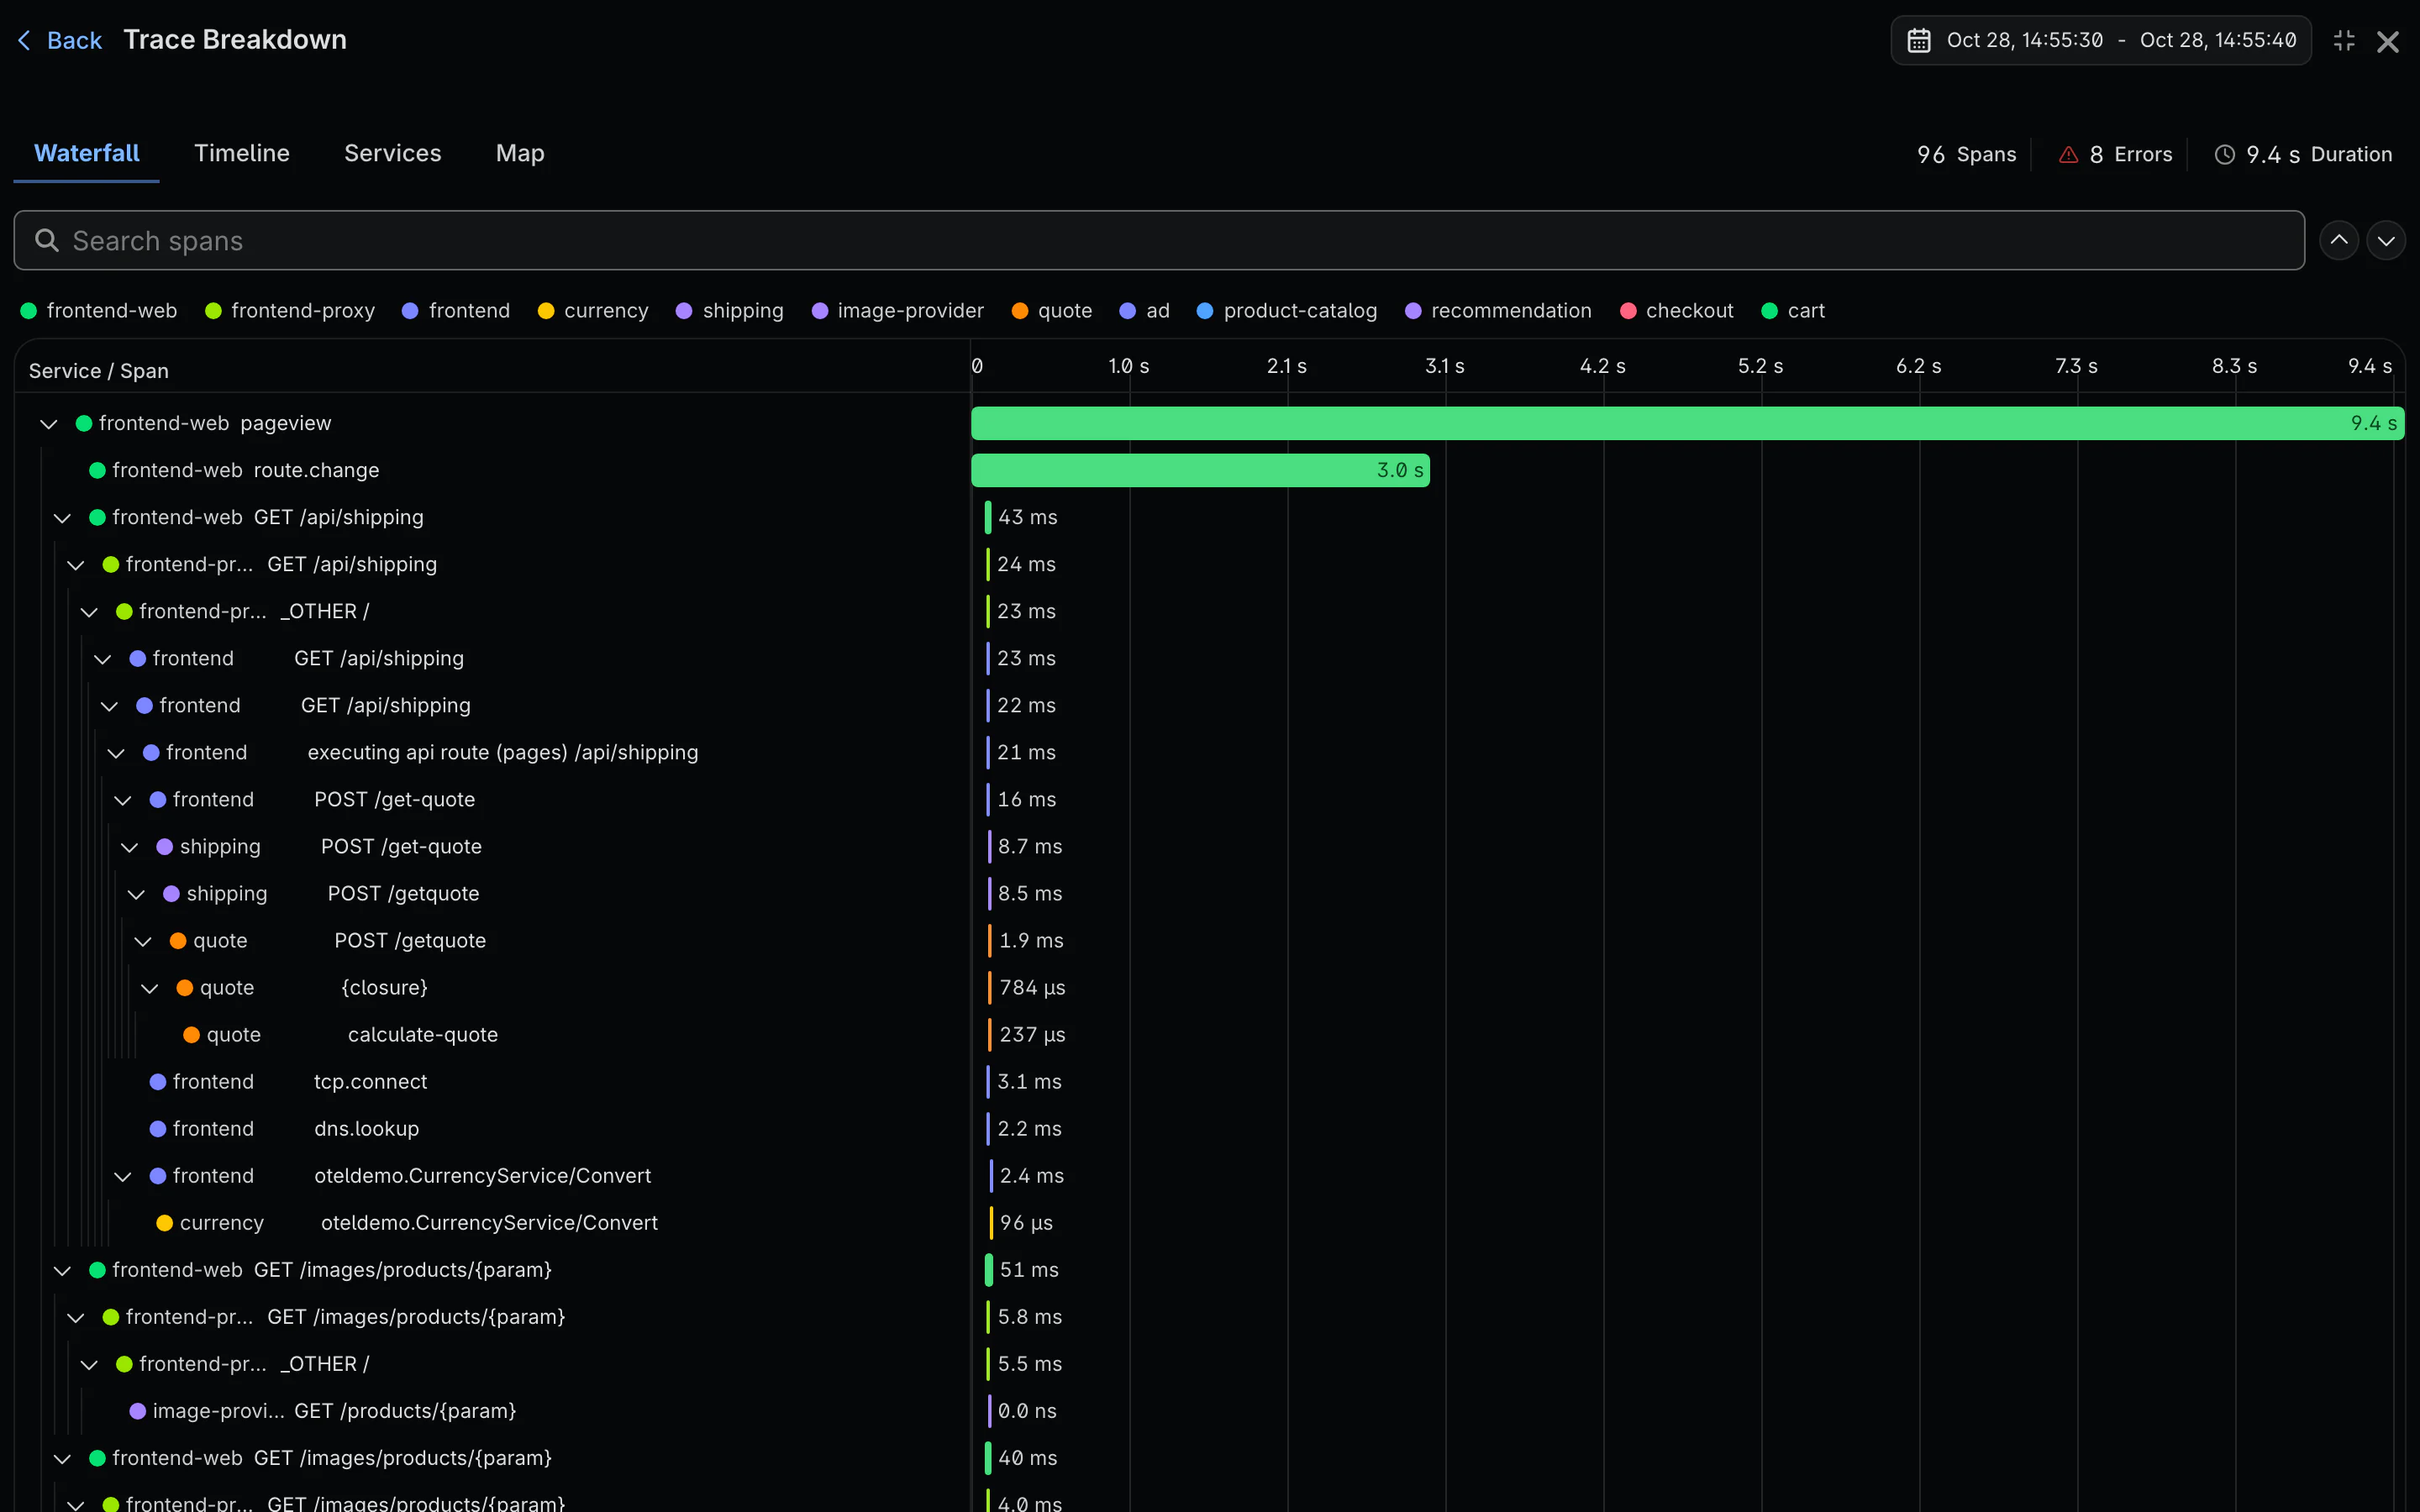
Logs & Traces
- Live Tail. A new tab streams matching logs or spans as they arrive. Filter with the usual query editor, see an accurate count of new rows, and pick up at the live edge when you scroll back down.
- Service map. A map of every service, with error rate, p95 latency, throughput and health on each card. Focus on one service, hover to trace a path, and filter by environment. Databases, queues and third-party hosts appear as their own nodes. Each trace has a Map tab too.
- Environments. Scope the whole app, including monitors, to one deployment environment.
- Latency column. Each row’s bar splits its duration by service or span kind, with a hover card and a legend for the whole result set. Service colors match the waterfall and the map.
- Metrics next to spans. A span’s related metrics cover its own time window, and metric charts mark example traces you can open.
-
Query editor. Unknown fields get a “Did you mean” hint, errors show above the editor, and suggestions after
|offer commands. - Large traces. Traces load 300 spans at a time, with a control to load more.
- The log list no longer freezes or goes blank, keeps its place on refresh, works by keyboard and has a phone layout. Sessions group by user when your SDK doesn’t send a session ID.
Issues
-
Acknowledge silences alerts. Until the issue regresses, or for 1 hour up to 1 week. When the time runs out the issue returns to the Inbox. Also in the API and with
monoscope issues ack --for. - Source code in stack traces. Frames are split and collapsible for JavaScript, Python, Java and Kotlin, Ruby, Go and PHP. The first frame from your code opens with the lines around the failure.
- Fewer duplicate endpoints. IDs inside URLs are recognized far better. New endpoint emails wait for grouping and are capped at 10 an hour per project.
- Issue pages load even when the trace is slow, and the Logs tab no longer loads the whole retention window.
Dashboards & Metrics
- Infrastructure. New Hosts, Containers, Container images, Kubernetes and Host map views, with facets, filters and a detail drawer. Containers cover Kubernetes pods, bare hosts and VMs, and Docker Swarm services.
- Integration dashboards. Dashboards for Postgres, MySQL, Redis, hosts, Docker, Kubernetes, the OpenTelemetry Collector, Nginx, Apache, RabbitMQ, HAProxy, Elasticsearch and MinIO are created automatically when their metrics show up.
- Add an explorer chart to a dashboard in one step. Required variables are asked for in place, and Copy SQL copies the SQL.
- Dashboards don’t shift while loading, and widgets load as they scroll into view.
CLI, MCP & Agents
-
Charts in the terminal.
monoscope dashboards renderandmonoscope chartdraw line, bar and stat charts, with--watch. -
Logs that read like logs. One event per line,
--format line|table|logfmt, andevents get --treedraws a trace waterfall. -
New commands.
monoscope statusfor a one-screen health check, andmonoscope opento open a trace, issue, dashboard or query in the browser. - A smaller standalone binary.
Session Replay
- Recordings show the user, and the Replay button only appears when a recording exists.
- The RUM page recognizes telemetry from the standard OpenTelemetry browser SDK and can be scoped to one browser service.
- The floating player drags properly and sits above the page.
Monitors & Alerts
- Trace links. Error alerts in Slack, email and Discord link to the trace with an hour of context around it.
- Slack alerts are more reliable on every channel you add, and the Integrations page warns when Slack needs reconnecting.
- Fixed an issue that could delay monitor checks. Alerts and dashboards no longer need a team.
Integrations
- Beyond GitHub. Code context and config sync work with GitLab (cloud and self-hosted), Gitea, Forgejo and Bitbucket Cloud.
- Code context can read from several service repositories, and git sync no longer misses pushes.
Onboarding & Billing
- Usage. The usage panel shows events, metric data points and session replays. Events include 20 million a month, then $1 per million.
- Invite emails open sign-up with the address filled in. Deleting a project cancels its subscription.
Performance
- Distinct counts are approximate, which makes grouped queries about a third faster. The query editor loads after the page.
- A tab left open across a deploy reloads itself instead of breaking.
Self-Hosting
- Live Tail works on the direct OTLP path, without Kafka.
-
The global service map needs
ENABLE_SERVICE_MAP_ROLLUPturned on. The per-trace map works without it. - The bundled collector config has a memory limiter.