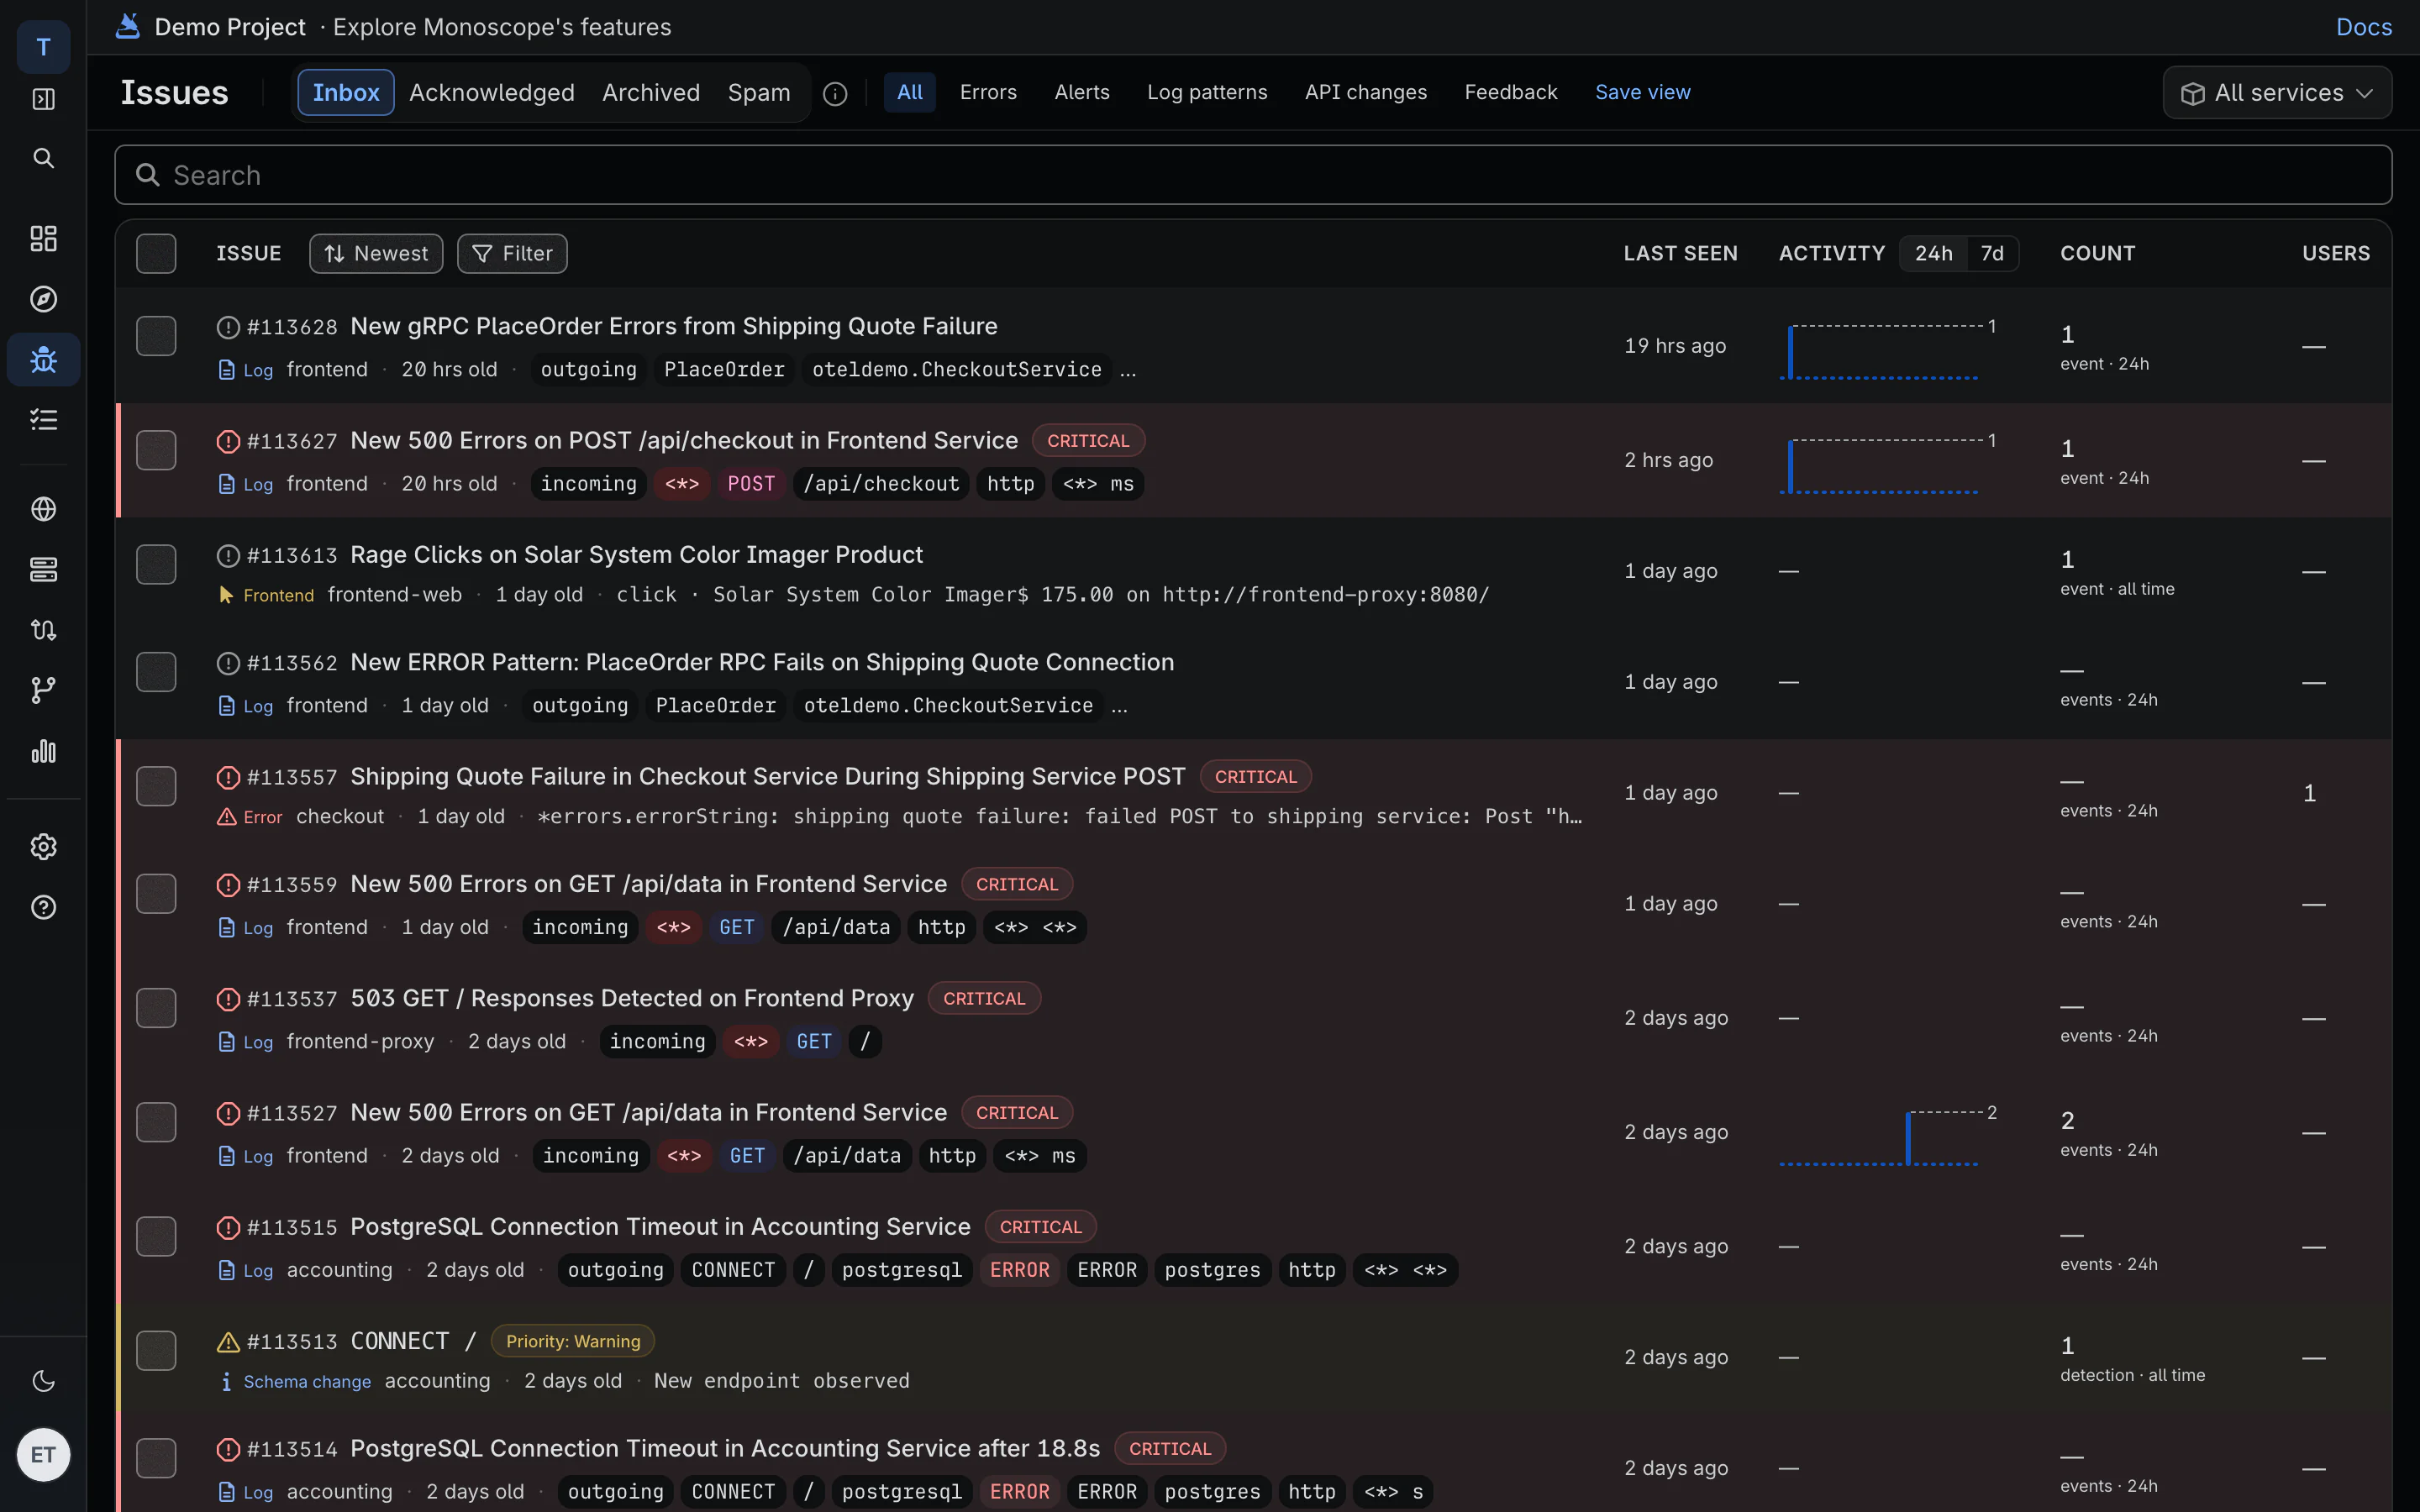
Issues
- Issue page. An events count up front, an event card with Highlights, Stack trace, Trace, Logs and Replay, and cards for the user, client and runtime. The HTTP request behind an error comes with a copyable cURL command. Step through events, see tag distributions, release markers and how many users were affected.
- Triage on every issue. Priority, assignee, resolve or resolve in next release, and archive for a set time or until it escalates. Comment, link GitHub, GitLab, Jira or Linear issues, and see who’s involved.
- Issues list. Age, Users, Priority and Assignee columns, bulk actions, saved views and filter chips.
- New issue types. N+1 and slow database queries, rage and dead clicks from the browser SDK, and user feedback with a Spam tab.
- Stack traces as frames. Your code shows as function and file:line, runtime frames fold away, and each frame can show its source.
- Query alerts show the breach. The threshold, the actual value, the query charted with its threshold line, and a link to the monitor.
- One issue per monitor. A monitor keeps one issue that reopens each time it fires, with one activity timeline. Issues sit right after Explorer in the navigation.
- Merging similar errors. Error groups that are the same failure with different messages can be merged at ingest, so the next variant joins the existing issue. It ships switched off for now.
- Every issue type shares one fact row: service, environment, first and last seen. Open in Explorer carries the exact query, and acknowledging is near-instant.
Monitors & Alerts
- Uptime checks. Two failed probes in a row open an uptime issue. The next success resolves it.
- Cron monitors. A missed or failed check-in opens an issue.
- Scope. Limit a monitor to one environment and service.
- Slack alerts share one format, keep their units, and the channel list is editable. Edits to a monitor’s query take effect, and saving notification settings keeps your channels on.
AI SRE
- Conversations. A page that lists your AI threads. Rename or delete them, or turn one into a recurring routine.
- Root cause on the issue. The issue page shows the AI’s root-cause verdict and asks for a fix plan in one click.
- Investigations in Slack. The AI investigates in the incident thread with a live checklist you can stop, using the incident’s evidence, related incidents, recent deploys and runbooks from linked repositories. The Slack thread and the issue’s chat share one history.
Routines
- Built-in catalog. 18 routines across reliability, telemetry quality, incidents, delivery, cost and security: a daily operations briefing, a weekly SLO review, an on-call handoff, a traffic drop watch, a telemetry cost watch and more.
- Run them daily, on weekdays, weekly or every few minutes. Report only when there’s a finding, deliver to Slack, and see recent runs.
Logs & Traces
- Query editor. Rewritten for faster autocomplete, with clearer suggestions.
- Learned API docs. The API catalog renders the schema monoscope learned from your traffic as OpenAPI 3.1 docs, downloadable as JSON or YAML.
-
Cleaner endpoints. Routes from Django, Express, Spring, Flask, Go and others normalize to
/{param}templates, and 404-only traffic no longer announces endpoints. - The chart switches visualization type, including when the AI picks one. The Sessions view is much faster, and a Last 30 days preset was added.
- Load more no longer skips rows, multiline messages display correctly, and the service map reads top-left to bottom-right.
Dashboards & Metrics
- Streaming charts. Charts fill in as results arrive, and changing the time range refreshes widgets in place.
- Trace lists. Recent, Error and Slowest Traces panels are full log lists with span expansion, live updates and sorting.
- Endpoint analytics include outgoing calls. Variable selectors are chips, and dashboards can be assigned to teams in bulk.
-
The app opens in dark mode until you pick a theme. The
bin()width dropdown and % of Total columns show correct values.
Session Replay
- RUM. Browser errors grouped by signature, browser, OS and device breakdowns, per-page Web Vitals ranked by traffic, and searchable sessions that open the replay.
- The player fits the recording’s shape, and session lists load the newest three hours first.
Integrations
- Weekly system reports. Weekly emails became dense system reports, dated in your project’s time zone.
- Idle hosts archive after 30 days and come back, with an email, when traffic returns.
CLI, MCP & Agents
-
Explicit time bounds are honored, trace IDs work in lookups, severity filters match, and
monoscope incidents listandgetwere added.
Onboarding & Billing
- Stripe-billed projects see the same billing cycle Stripe bills, with each past invoice linked.
Self-Hosting
-
Point
GEOIP_DB_PATHat a MaxMind, IPinfo or DB-IP database to map errors by client IP.