Distributed tracing
Distributed tracing that keeps the request body
Follow one request through every service in a waterfall, with its logs, queries and outgoing calls. The bodies stay on the trace, so the AI SRE reads what was sent, not a span name.
01 · One request, every service
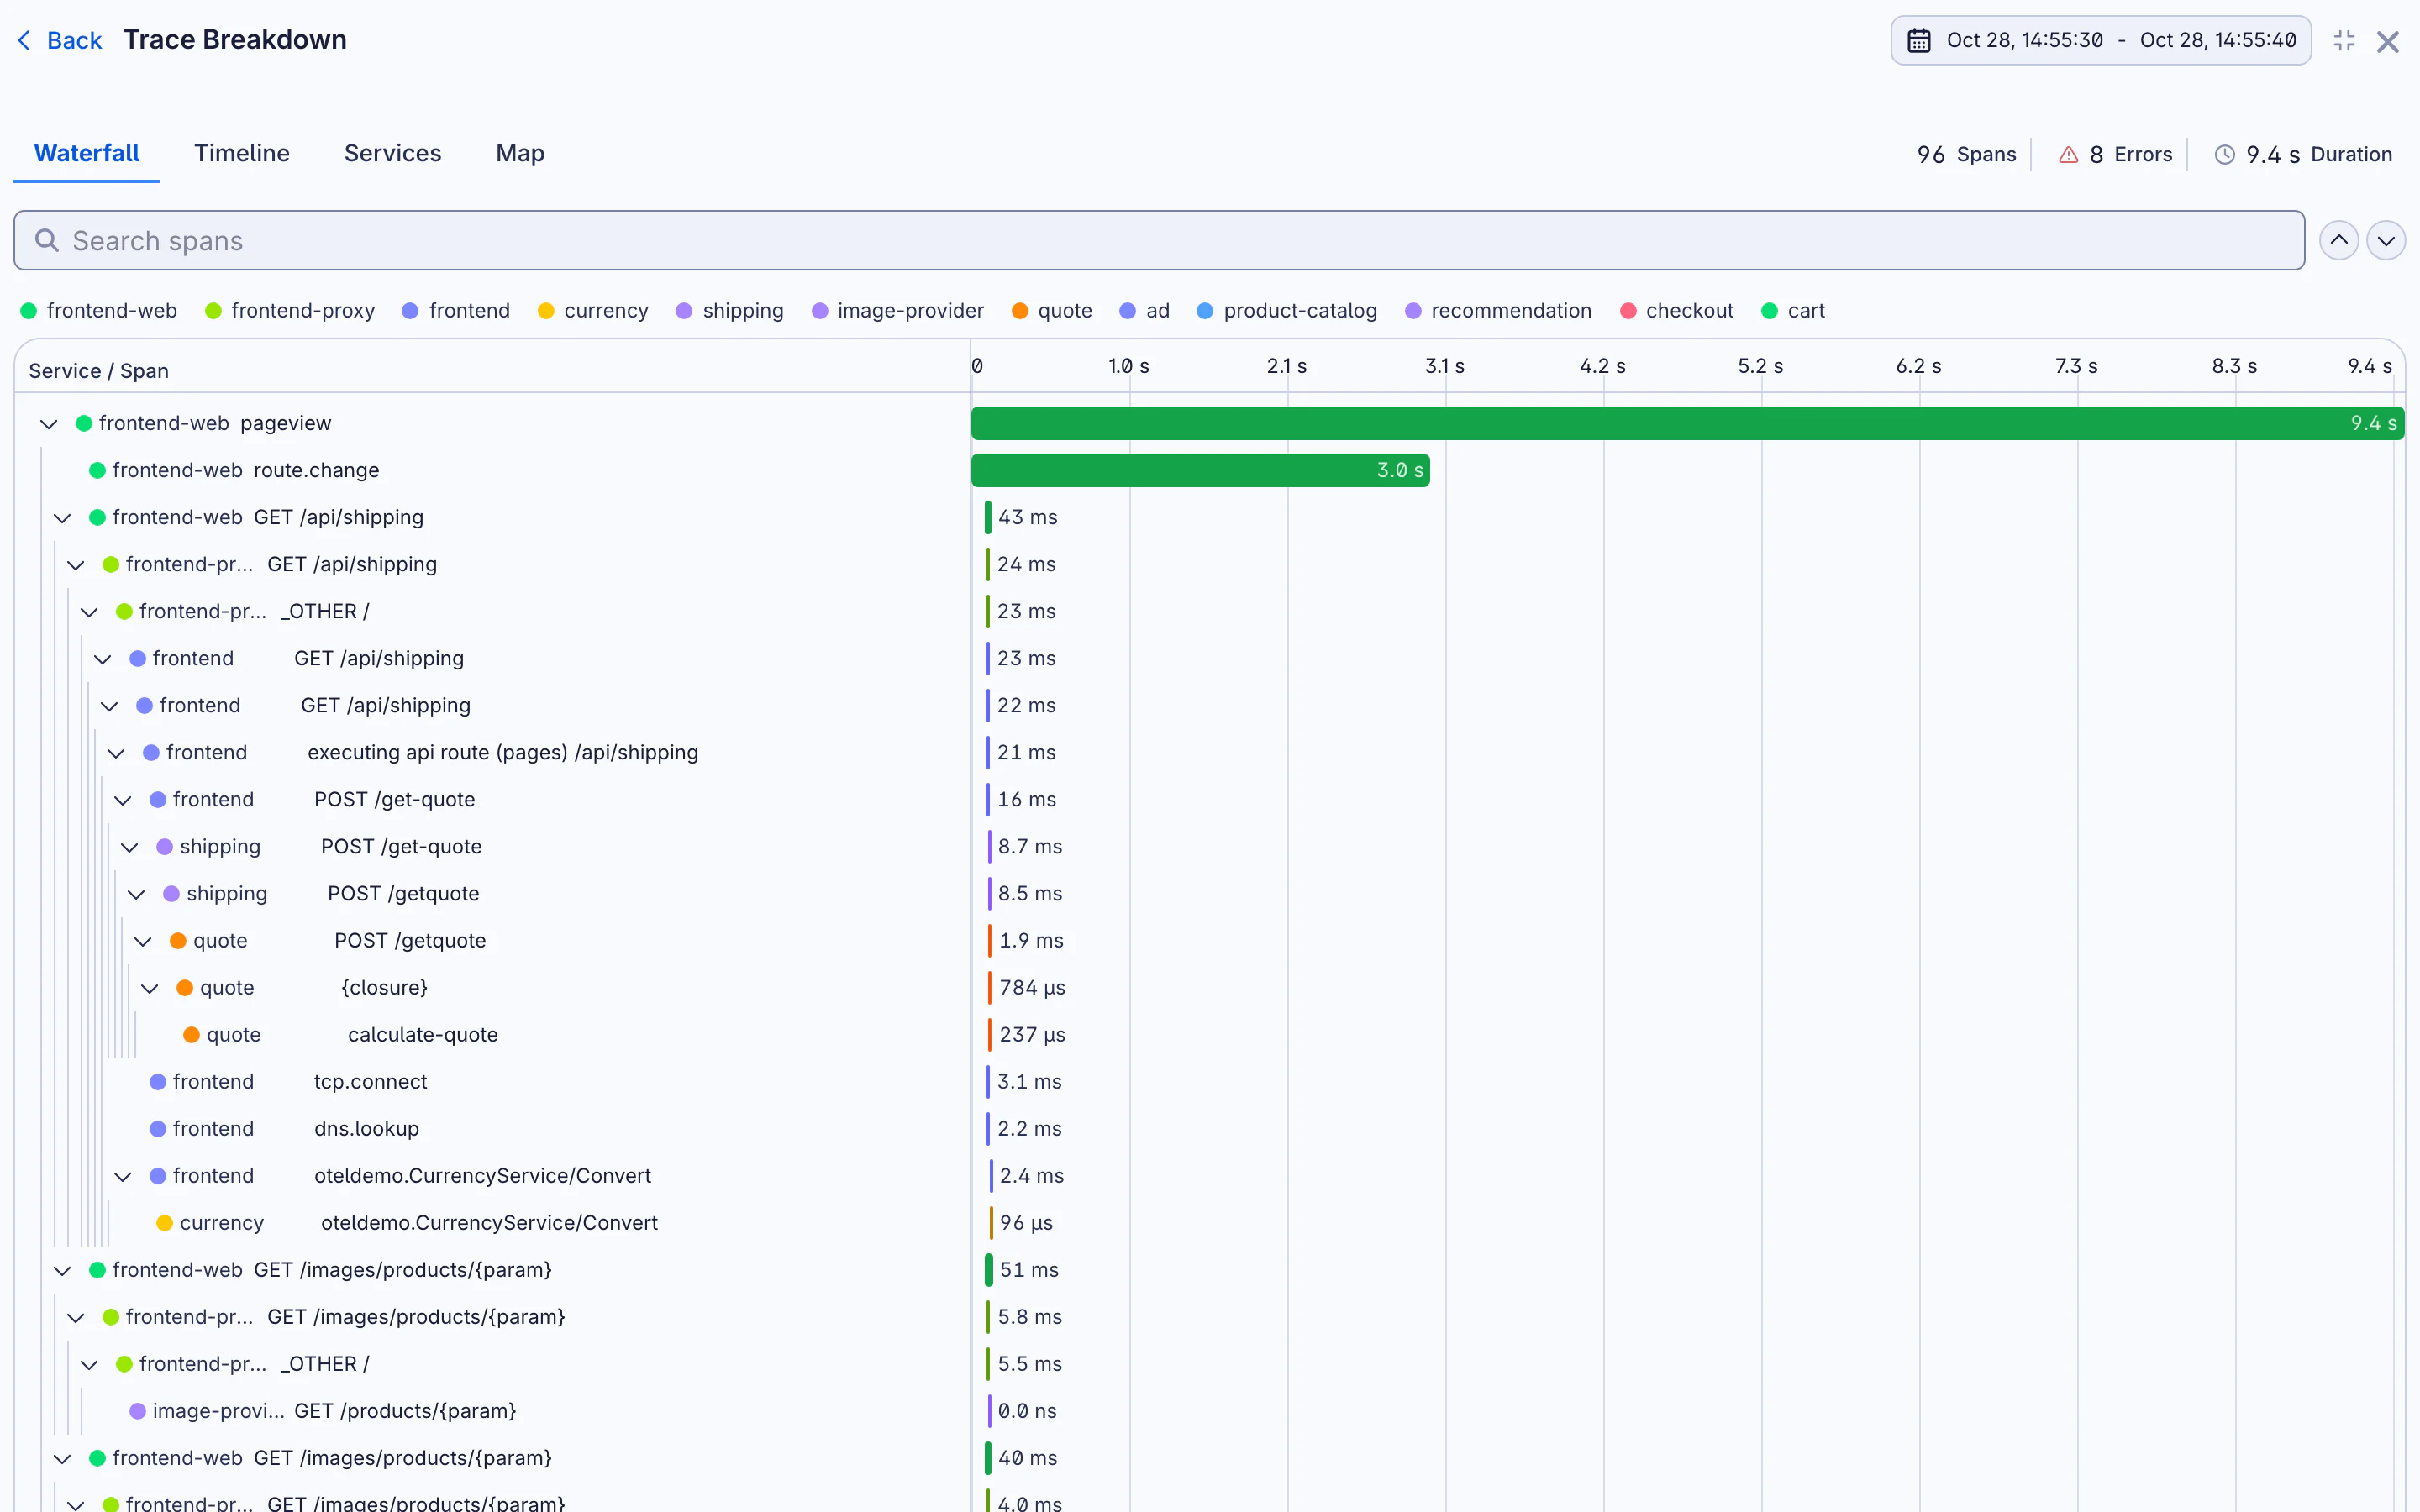
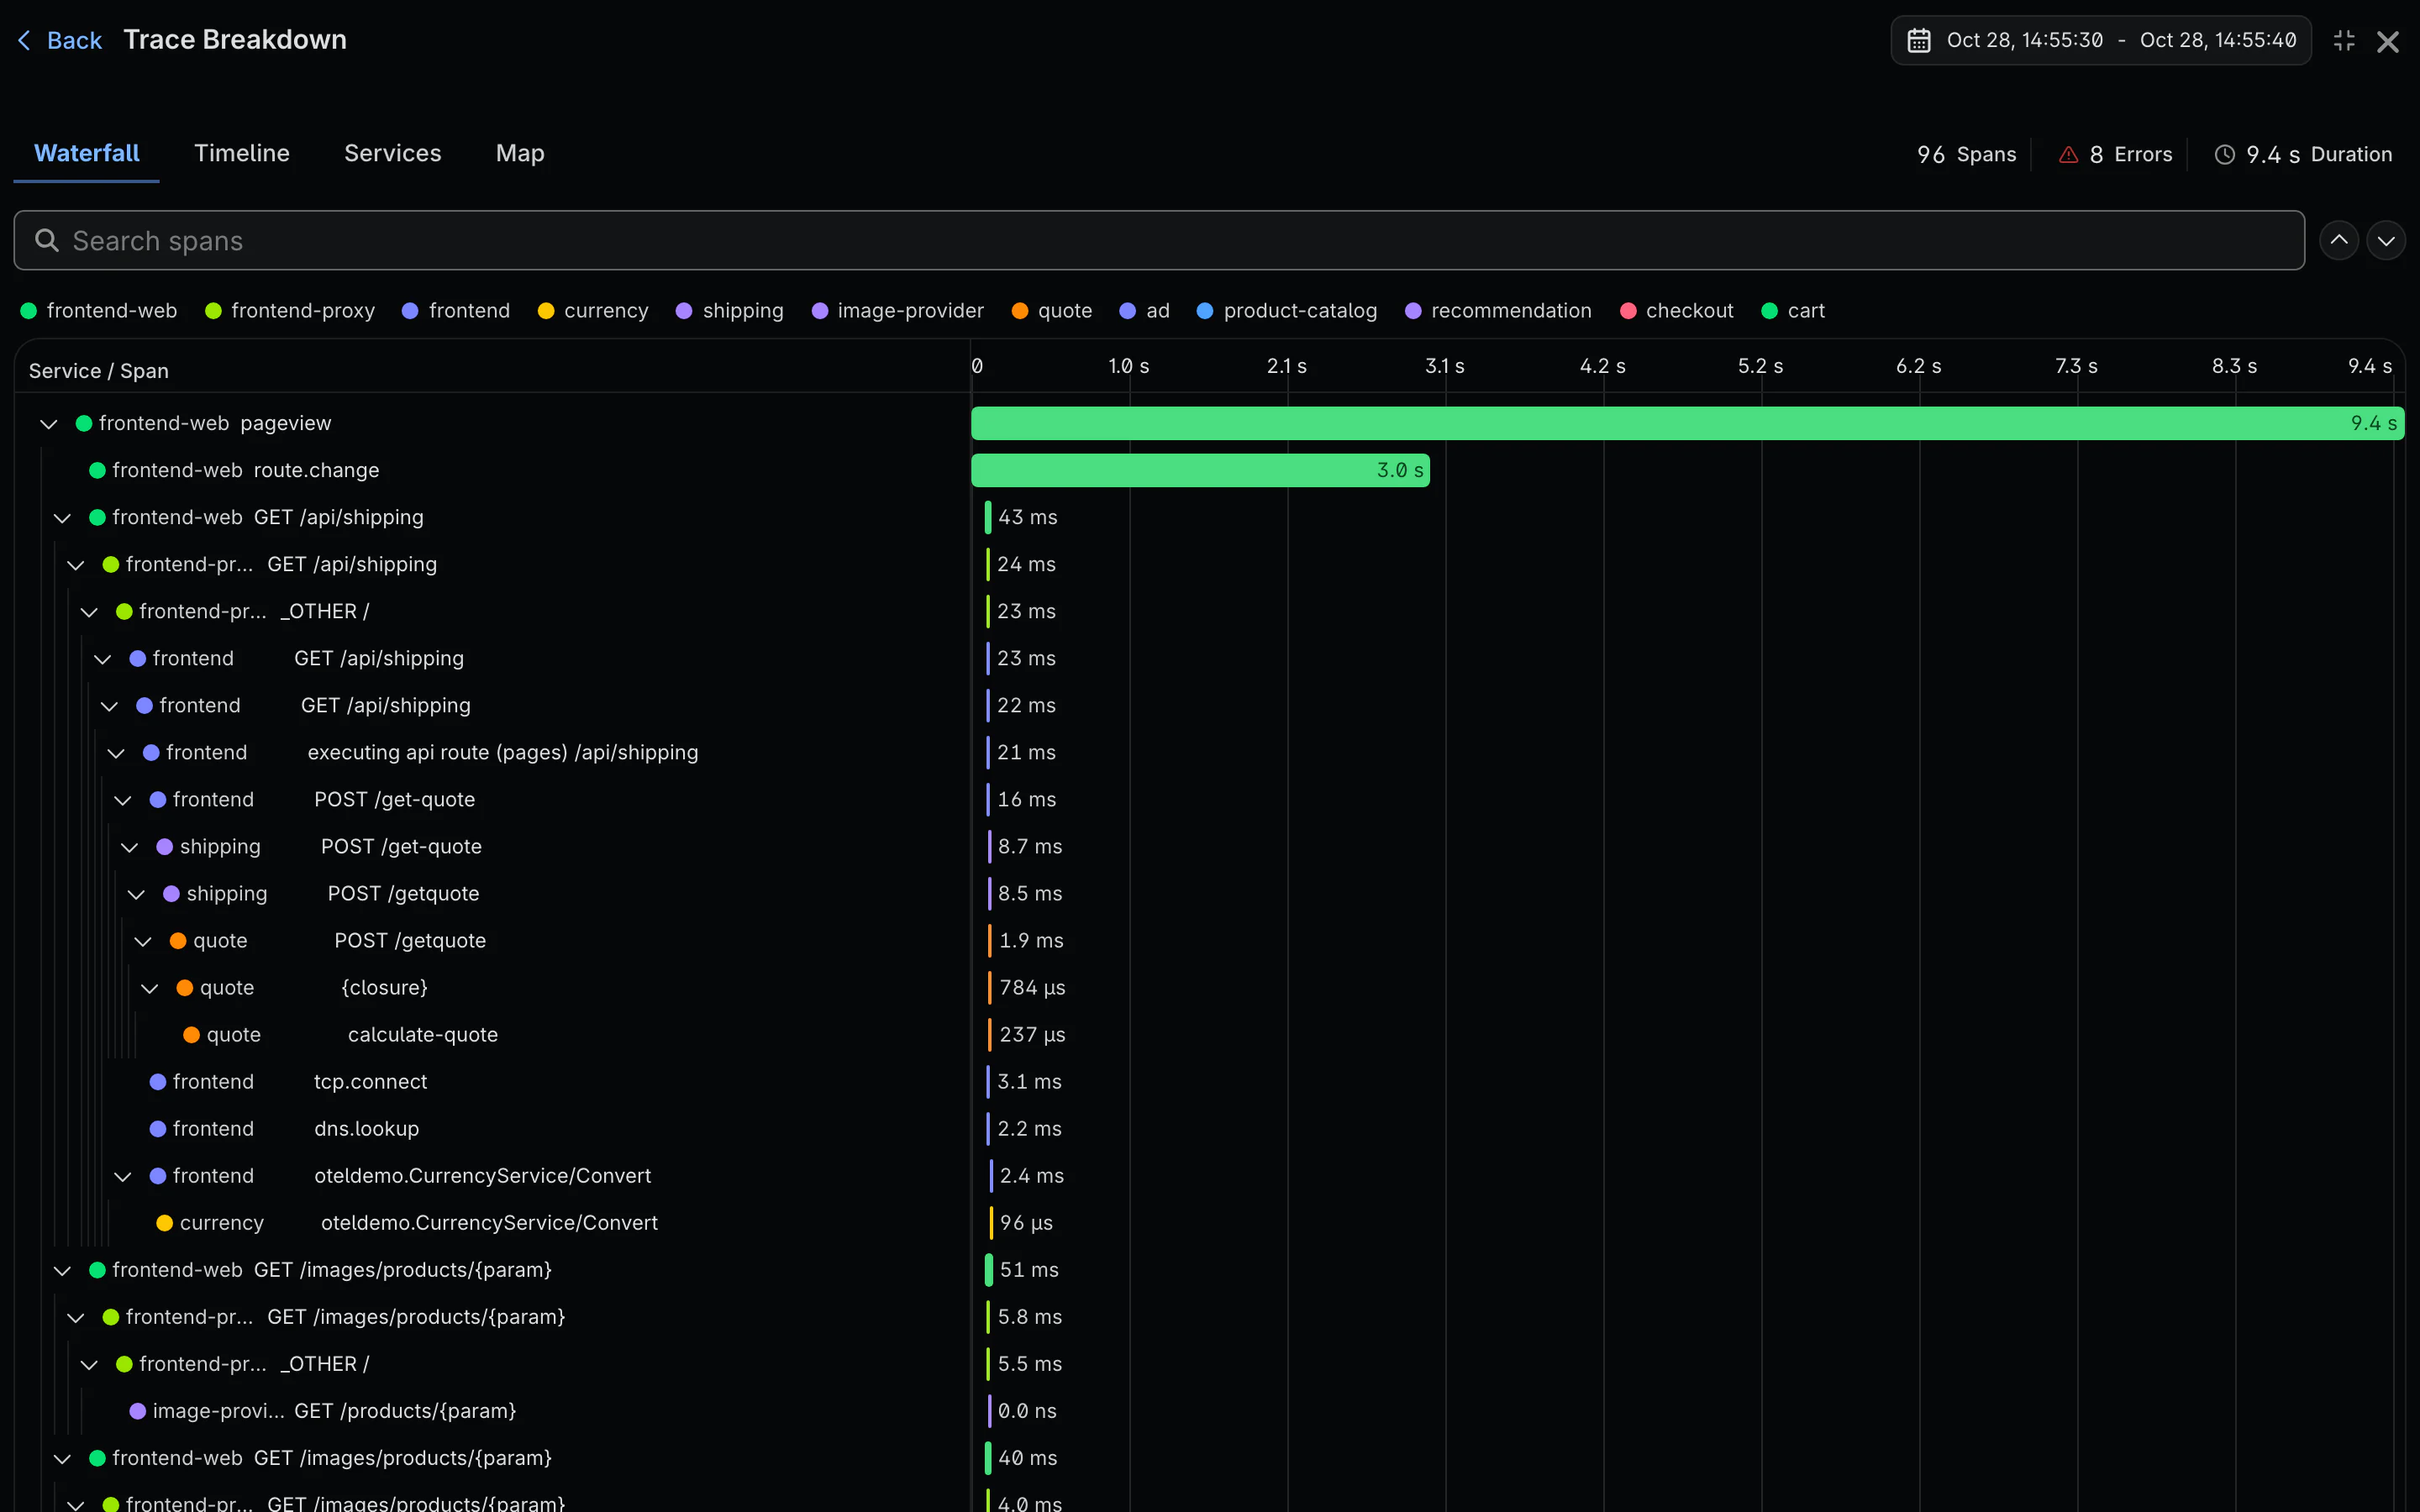
See where the 9 seconds went
Open any log line or request and click View trace. The header shows the span count, the spans with errors and the total duration; Trace Breakdown shows each service's share of the time.
-
Four views of the same spans
Waterfall, a flame-graph timeline, a per-service list and a map of the calls between services.
-
Logs next to their span
Logs that carry the trace context sit beside the span that wrote them, in order.
-
From an issue, too
Every issue shows the trace of the event you're looking at, so the error and its path are on one screen.
02 · The payload
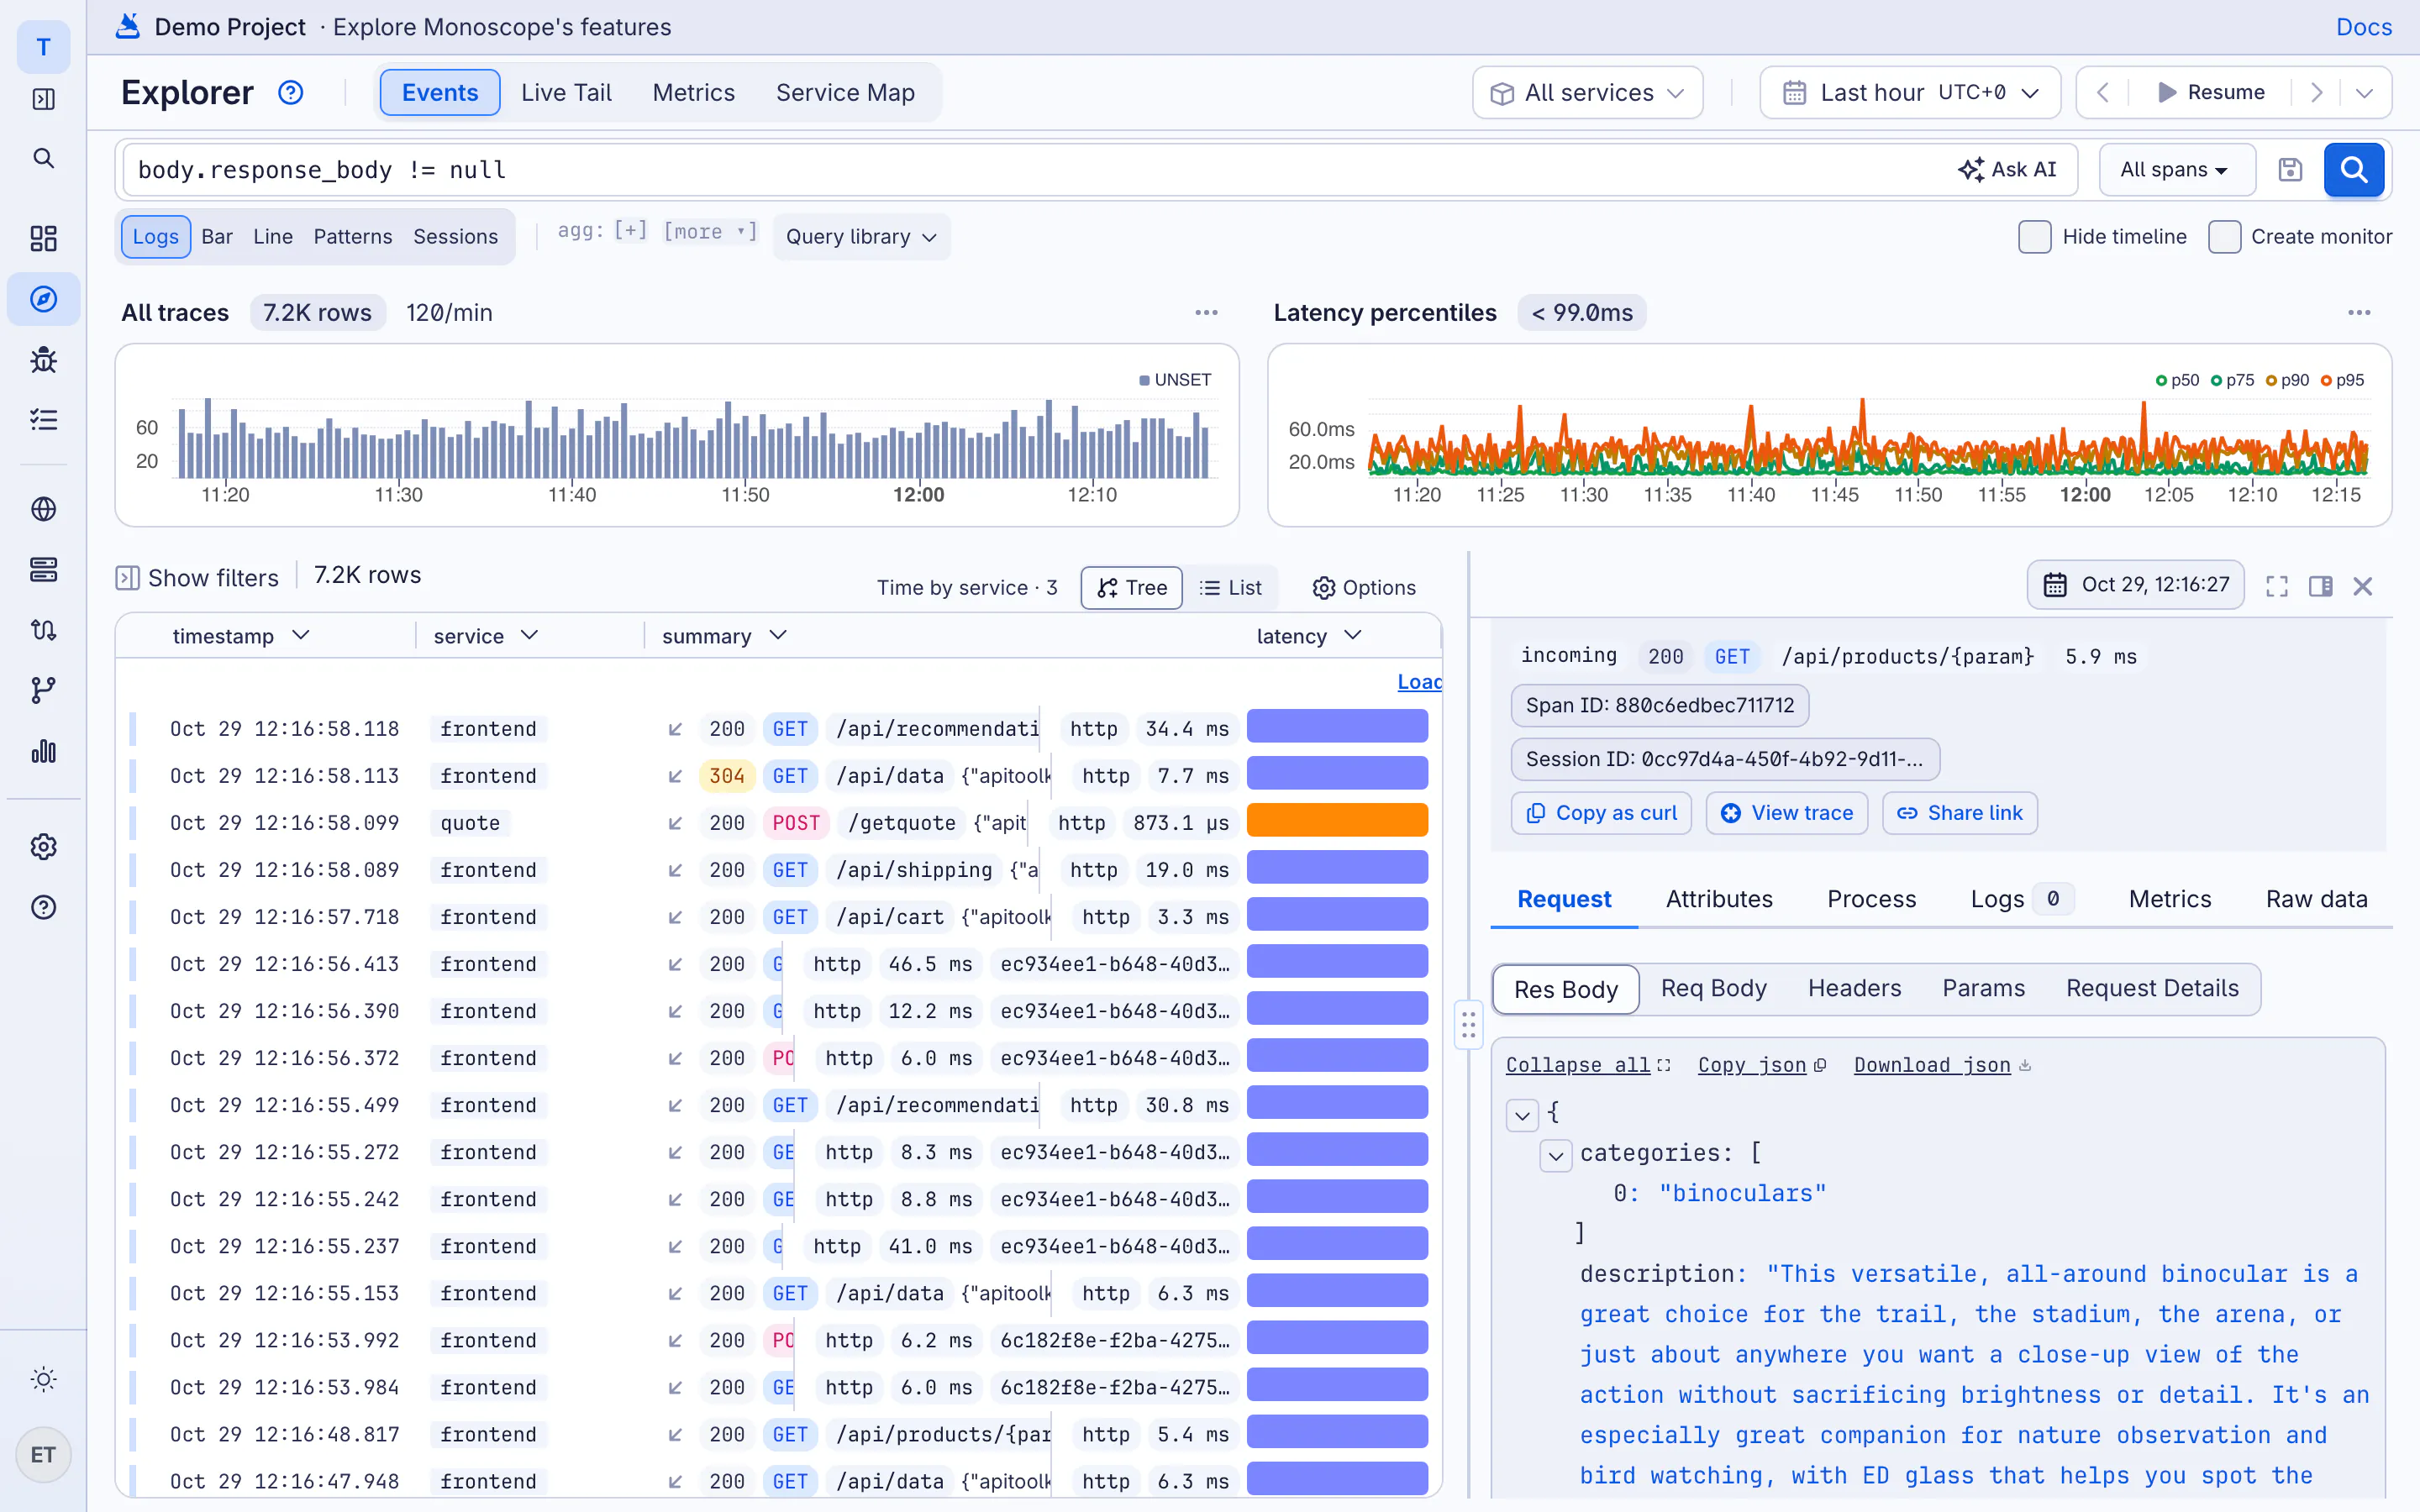
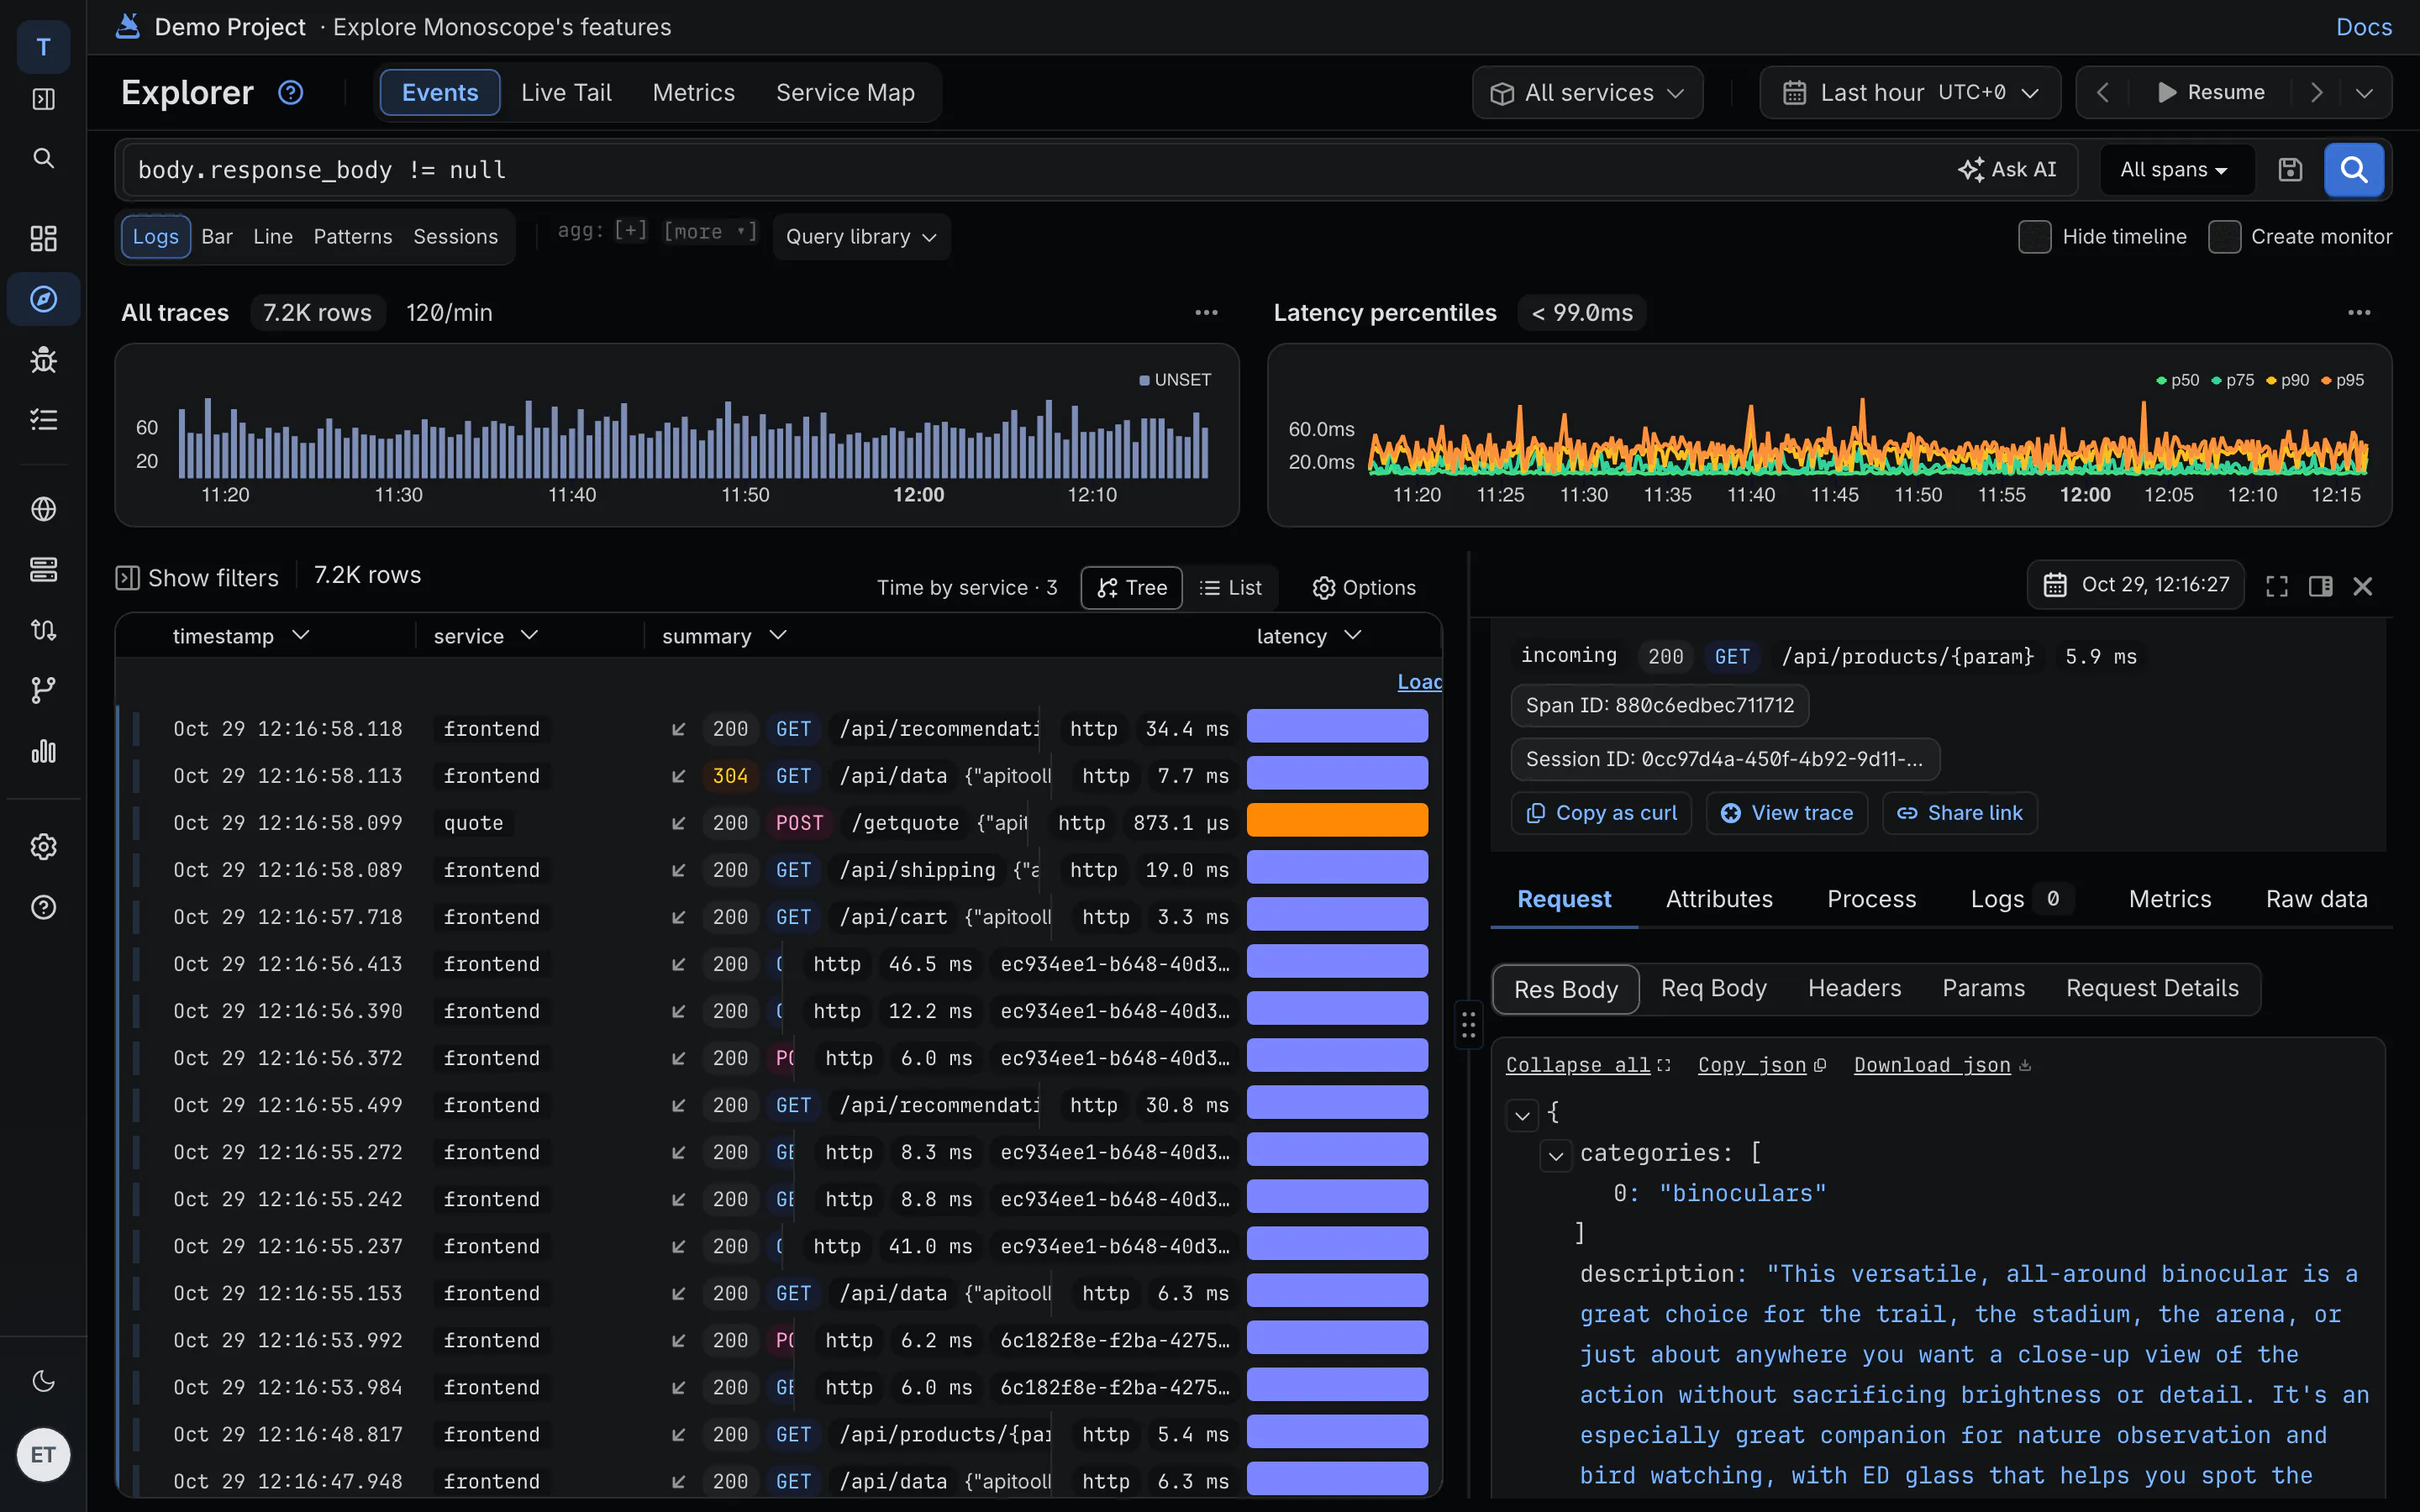
The span says 502. The body says why.
With our SDKs, the spans for incoming requests and outgoing calls carry their headers, request body and response body. The supplier that answered 200 with an empty tracking_id shows up in the trace, with the response it sent.
-
Incoming and outgoing
Your own endpoints and the payment, shipping and KYC APIs you call, on the same trace.
-
Kept on Cloud
Every span you send is kept for 30 days. The trace you need from last Tuesday is still complete.
-
Redacted before it leaves
Headers and JSON paths you list, such as $.card.number, are removed inside your app.
03 · Service map
Which service calls which, and which one is failing
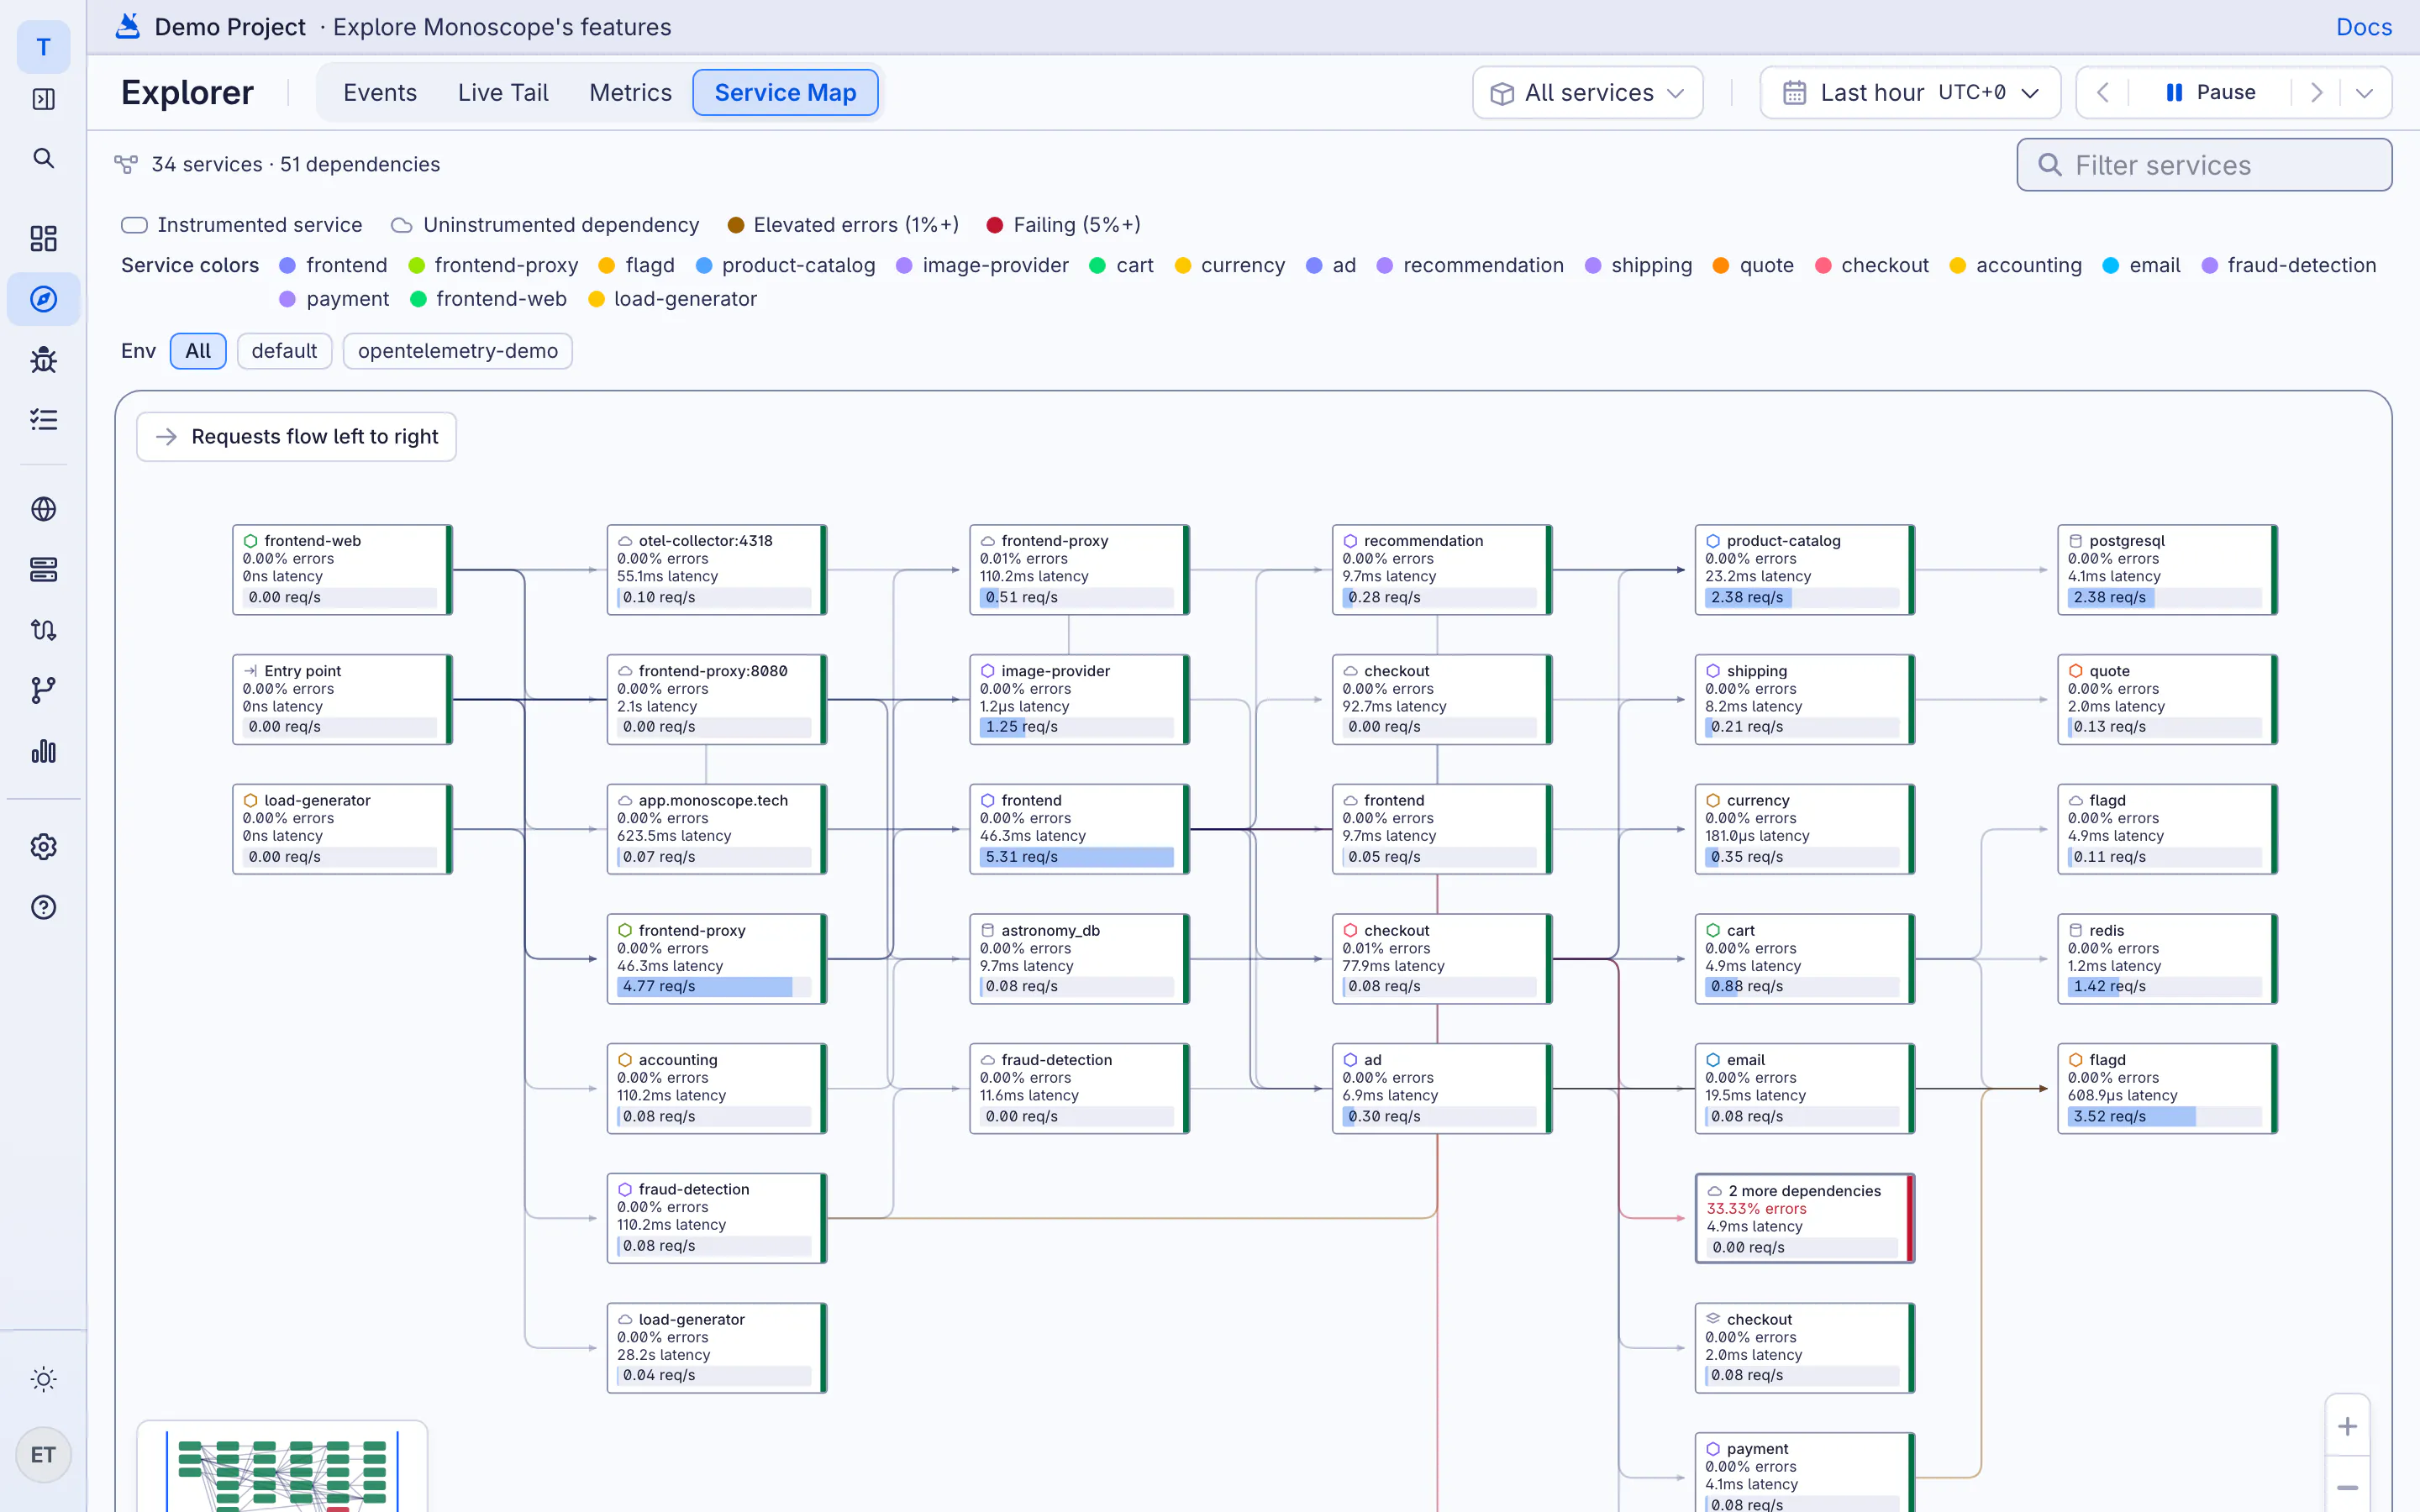
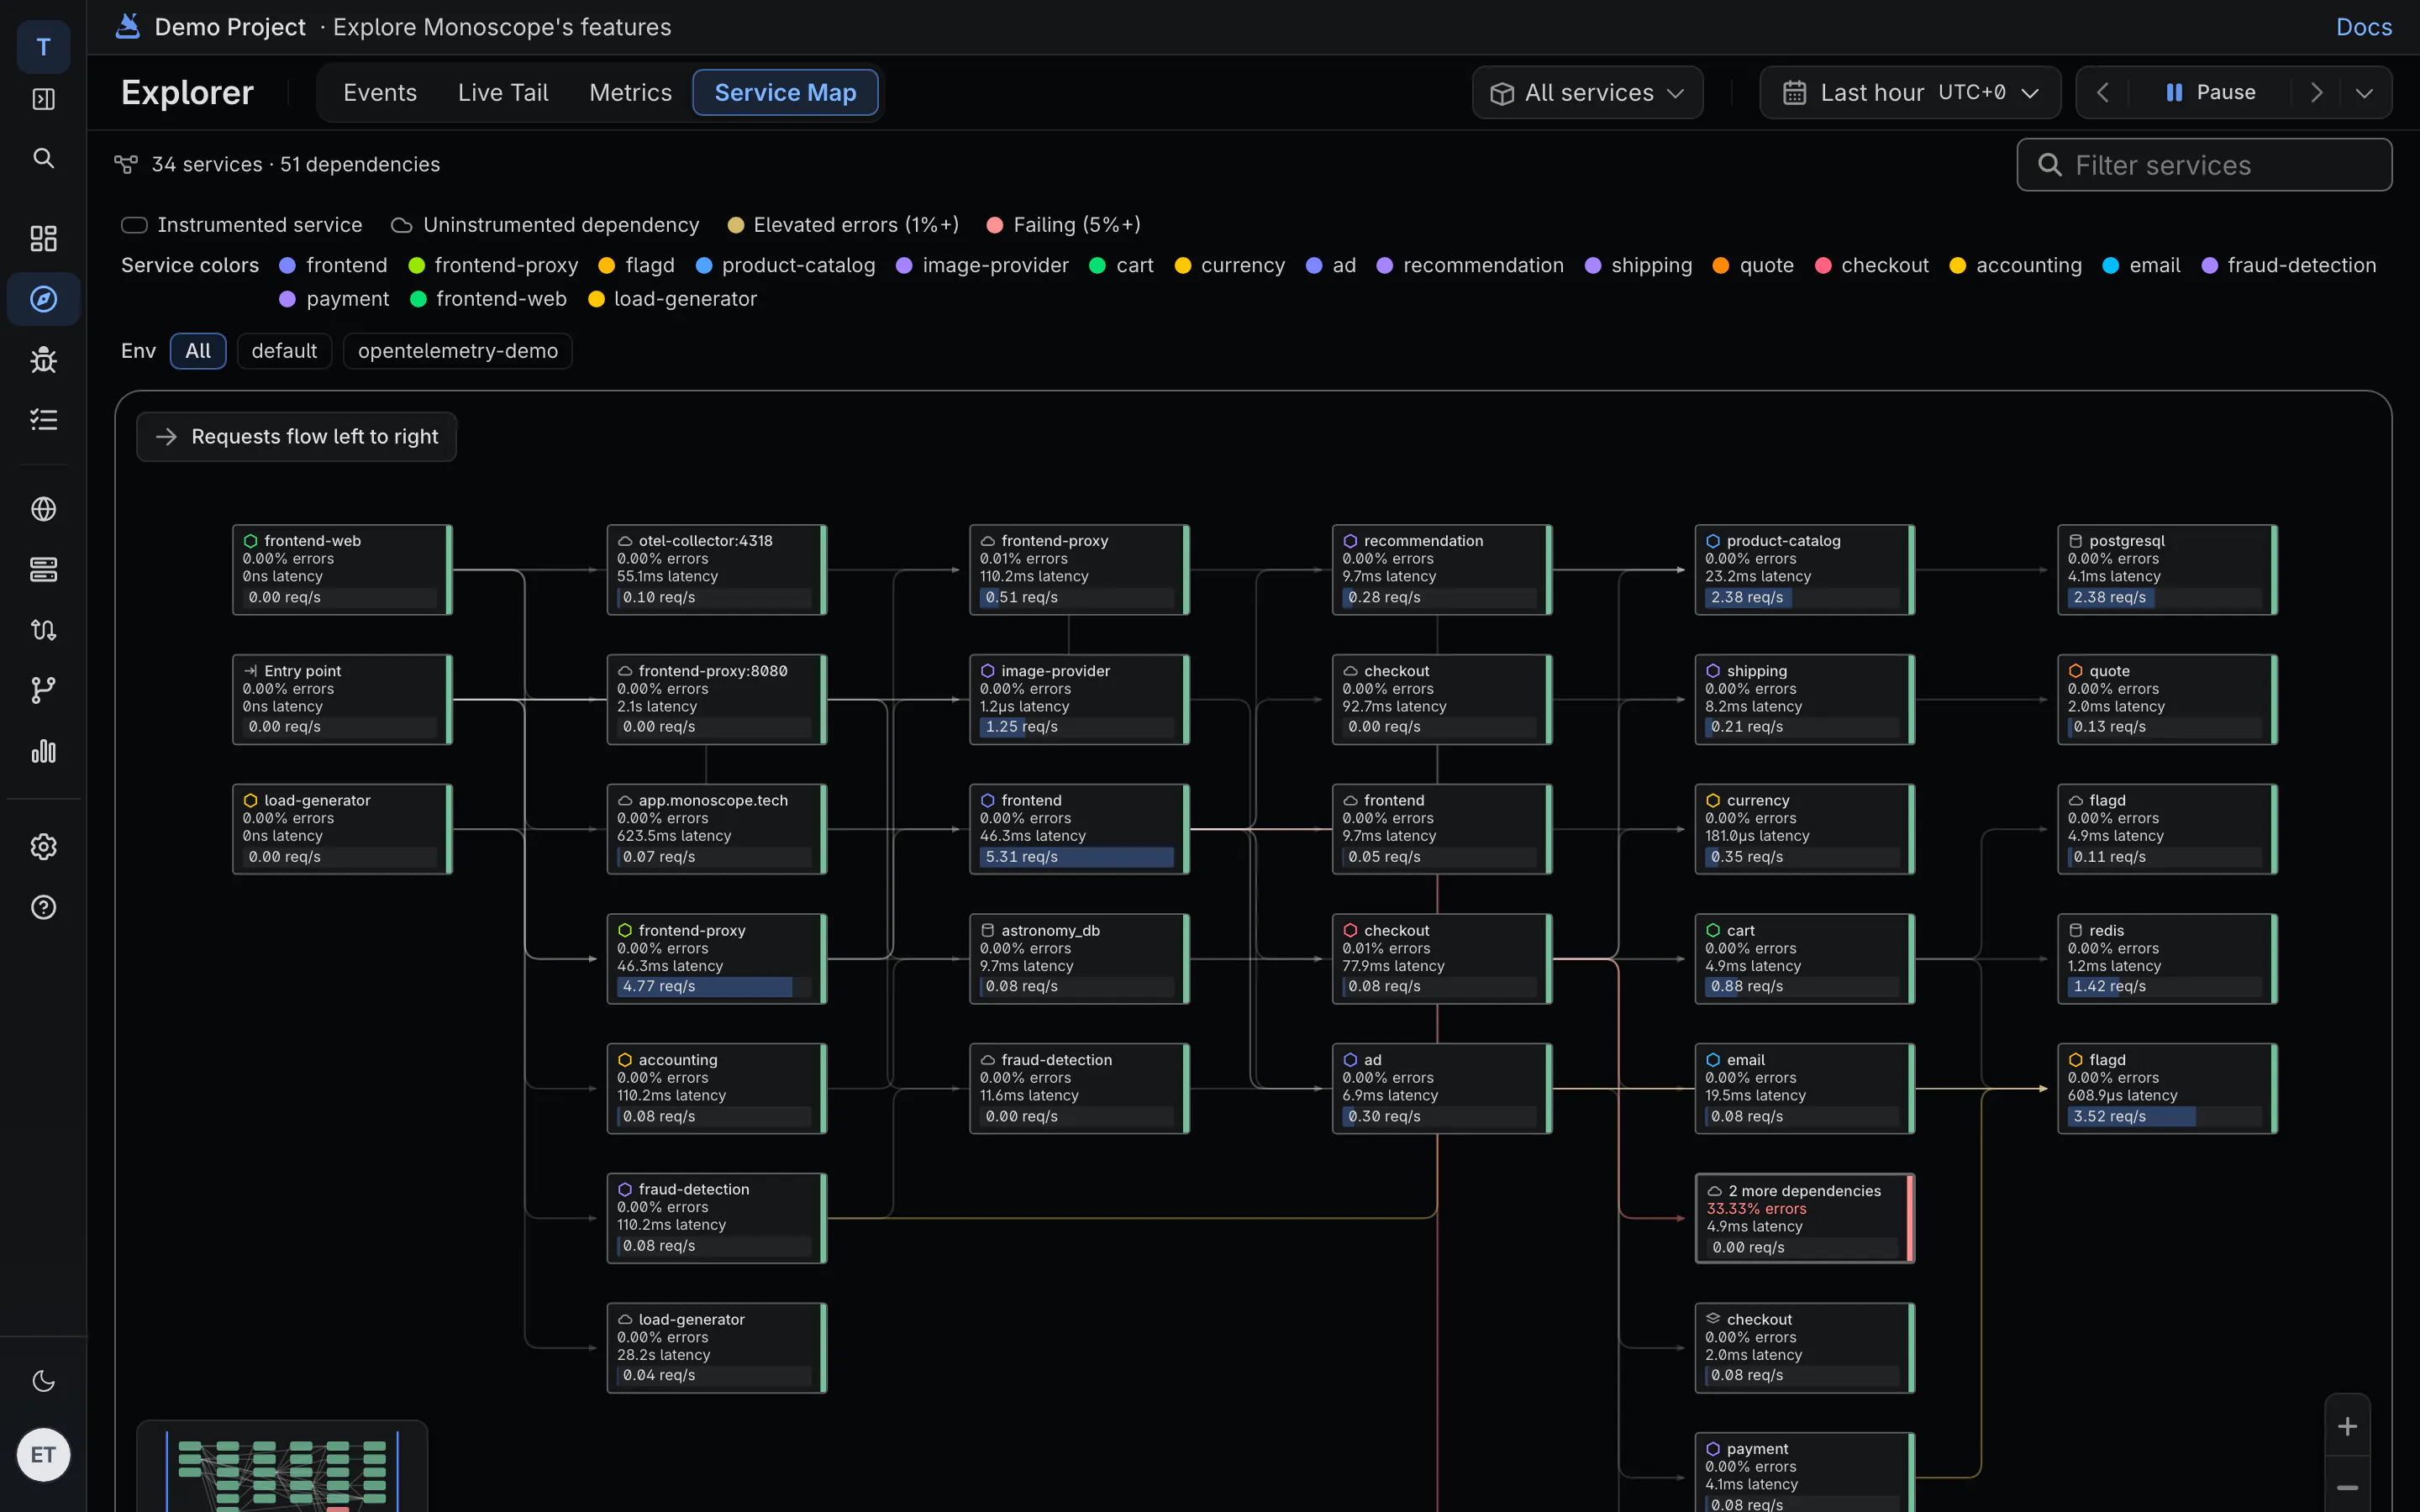
monoscope draws the map from your spans: every service, database, queue and third-party API, with request rate, error rate and latency on each node. A dependency group with errors is marked.
-
Built from traffic
No service catalog to maintain. A new service appears the first time it sends a span.
-
Dependencies that degrade
The Dependency degradation digest routine names downstream calls that got slower or started failing, and who calls them.
-
Broken context, found
The Trace correlation audit routine finds services whose logs and spans can't be joined.
04 · OpenTelemetry
Send traces from any OpenTelemetry SDK
Set the OTLP endpoint and your API key, and spans arrive. Our SDKs for Node.js, Python, Go, PHP, Java, .NET and Elixir add request and response bodies on top.
Environment · any OpenTelemetry SDK
OTEL_EXPORTER_OTLP_ENDPOINT="http://otelcol.monoscope.tech:4317"
OTEL_EXPORTER_OTLP_PROTOCOL="grpc"
OTEL_SERVICE_NAME="checkout"
OTEL_RESOURCE_ATTRIBUTES="x-api-key=YOUR_API_KEY"
Questions
Are traces sampled?
Not on Cloud. Every span you send is kept for 30 days. The free plan covers 10k events a day.
How are traces priced?
Each span is one event. Free for 10k events a day; Cloud is $29 a month for 20M events, then $1 per million. Bodies don't add to the count.
Do I have to replace my tracing setup?
No. If you already export OpenTelemetry, add monoscope as an exporter in your collector and run it beside your current tool.
Can I find a trace by ID?
Yes. Filter the Explorer on context.trace_id, or open the trace from any log line or issue.
Can I share a trace with someone outside the team?
Yes. A read-only link to the request opens for anyone for 48 hours, no account needed.