
Metrics & dashboards
Dashboards and alerts on every query
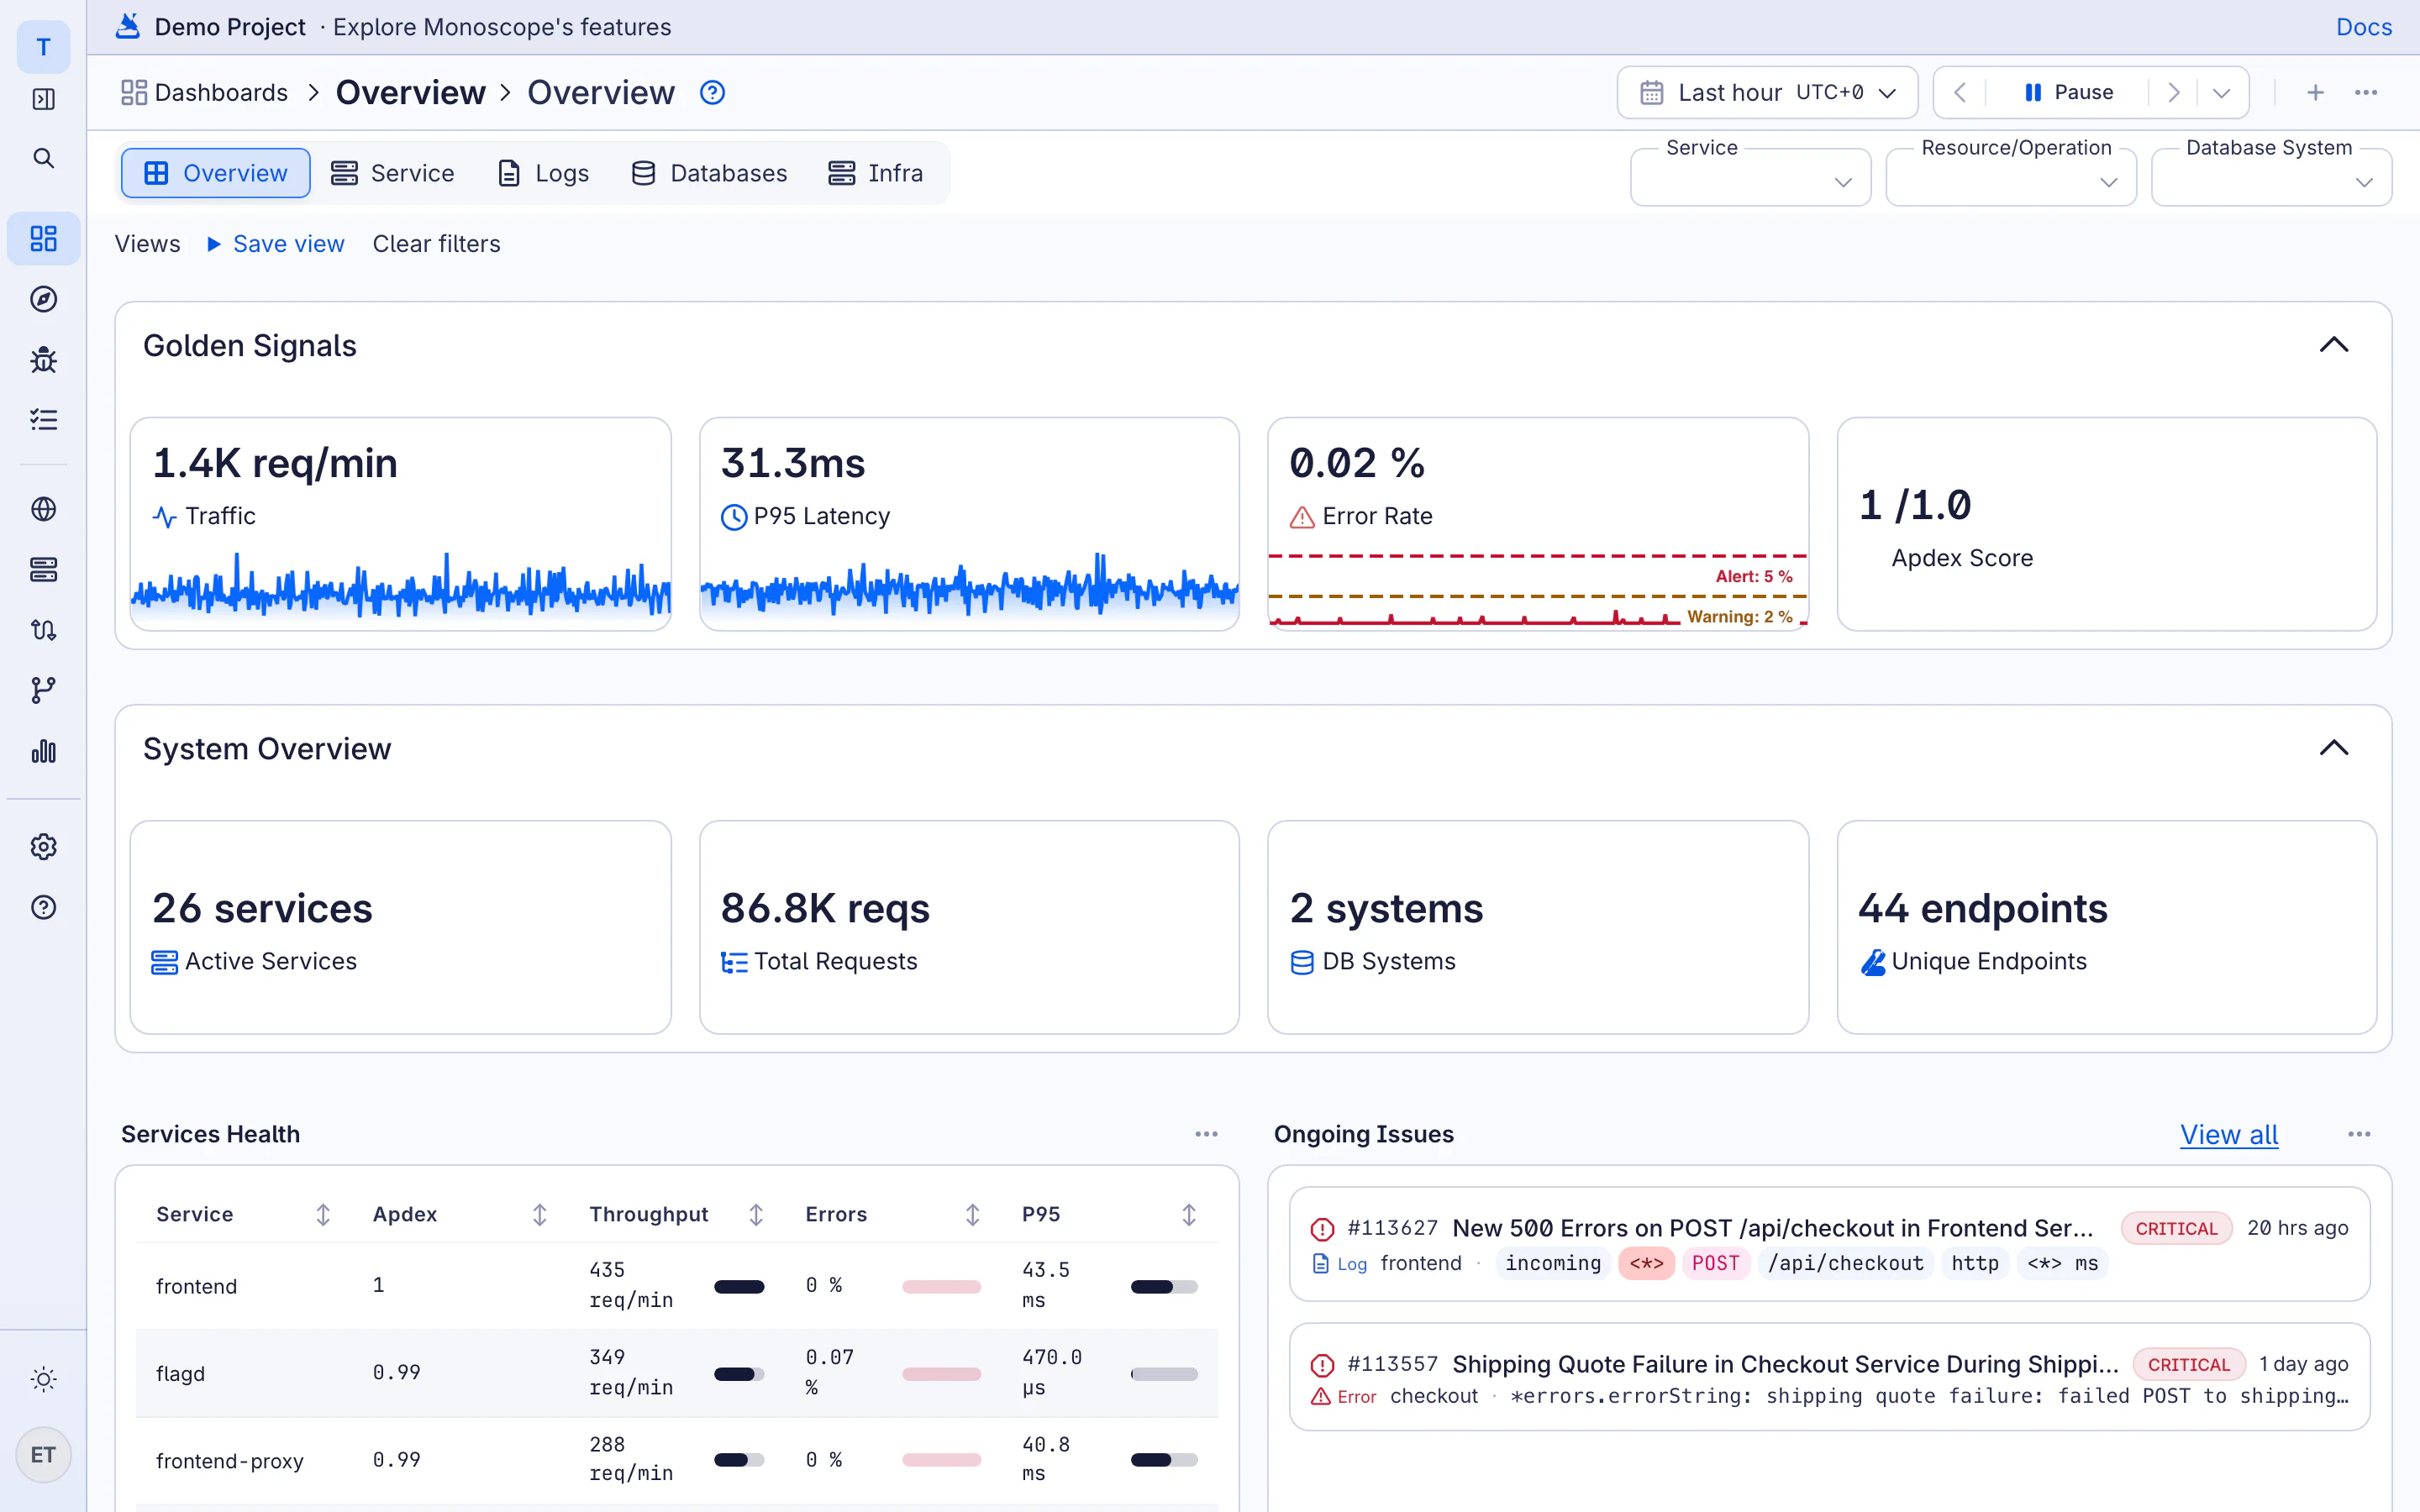
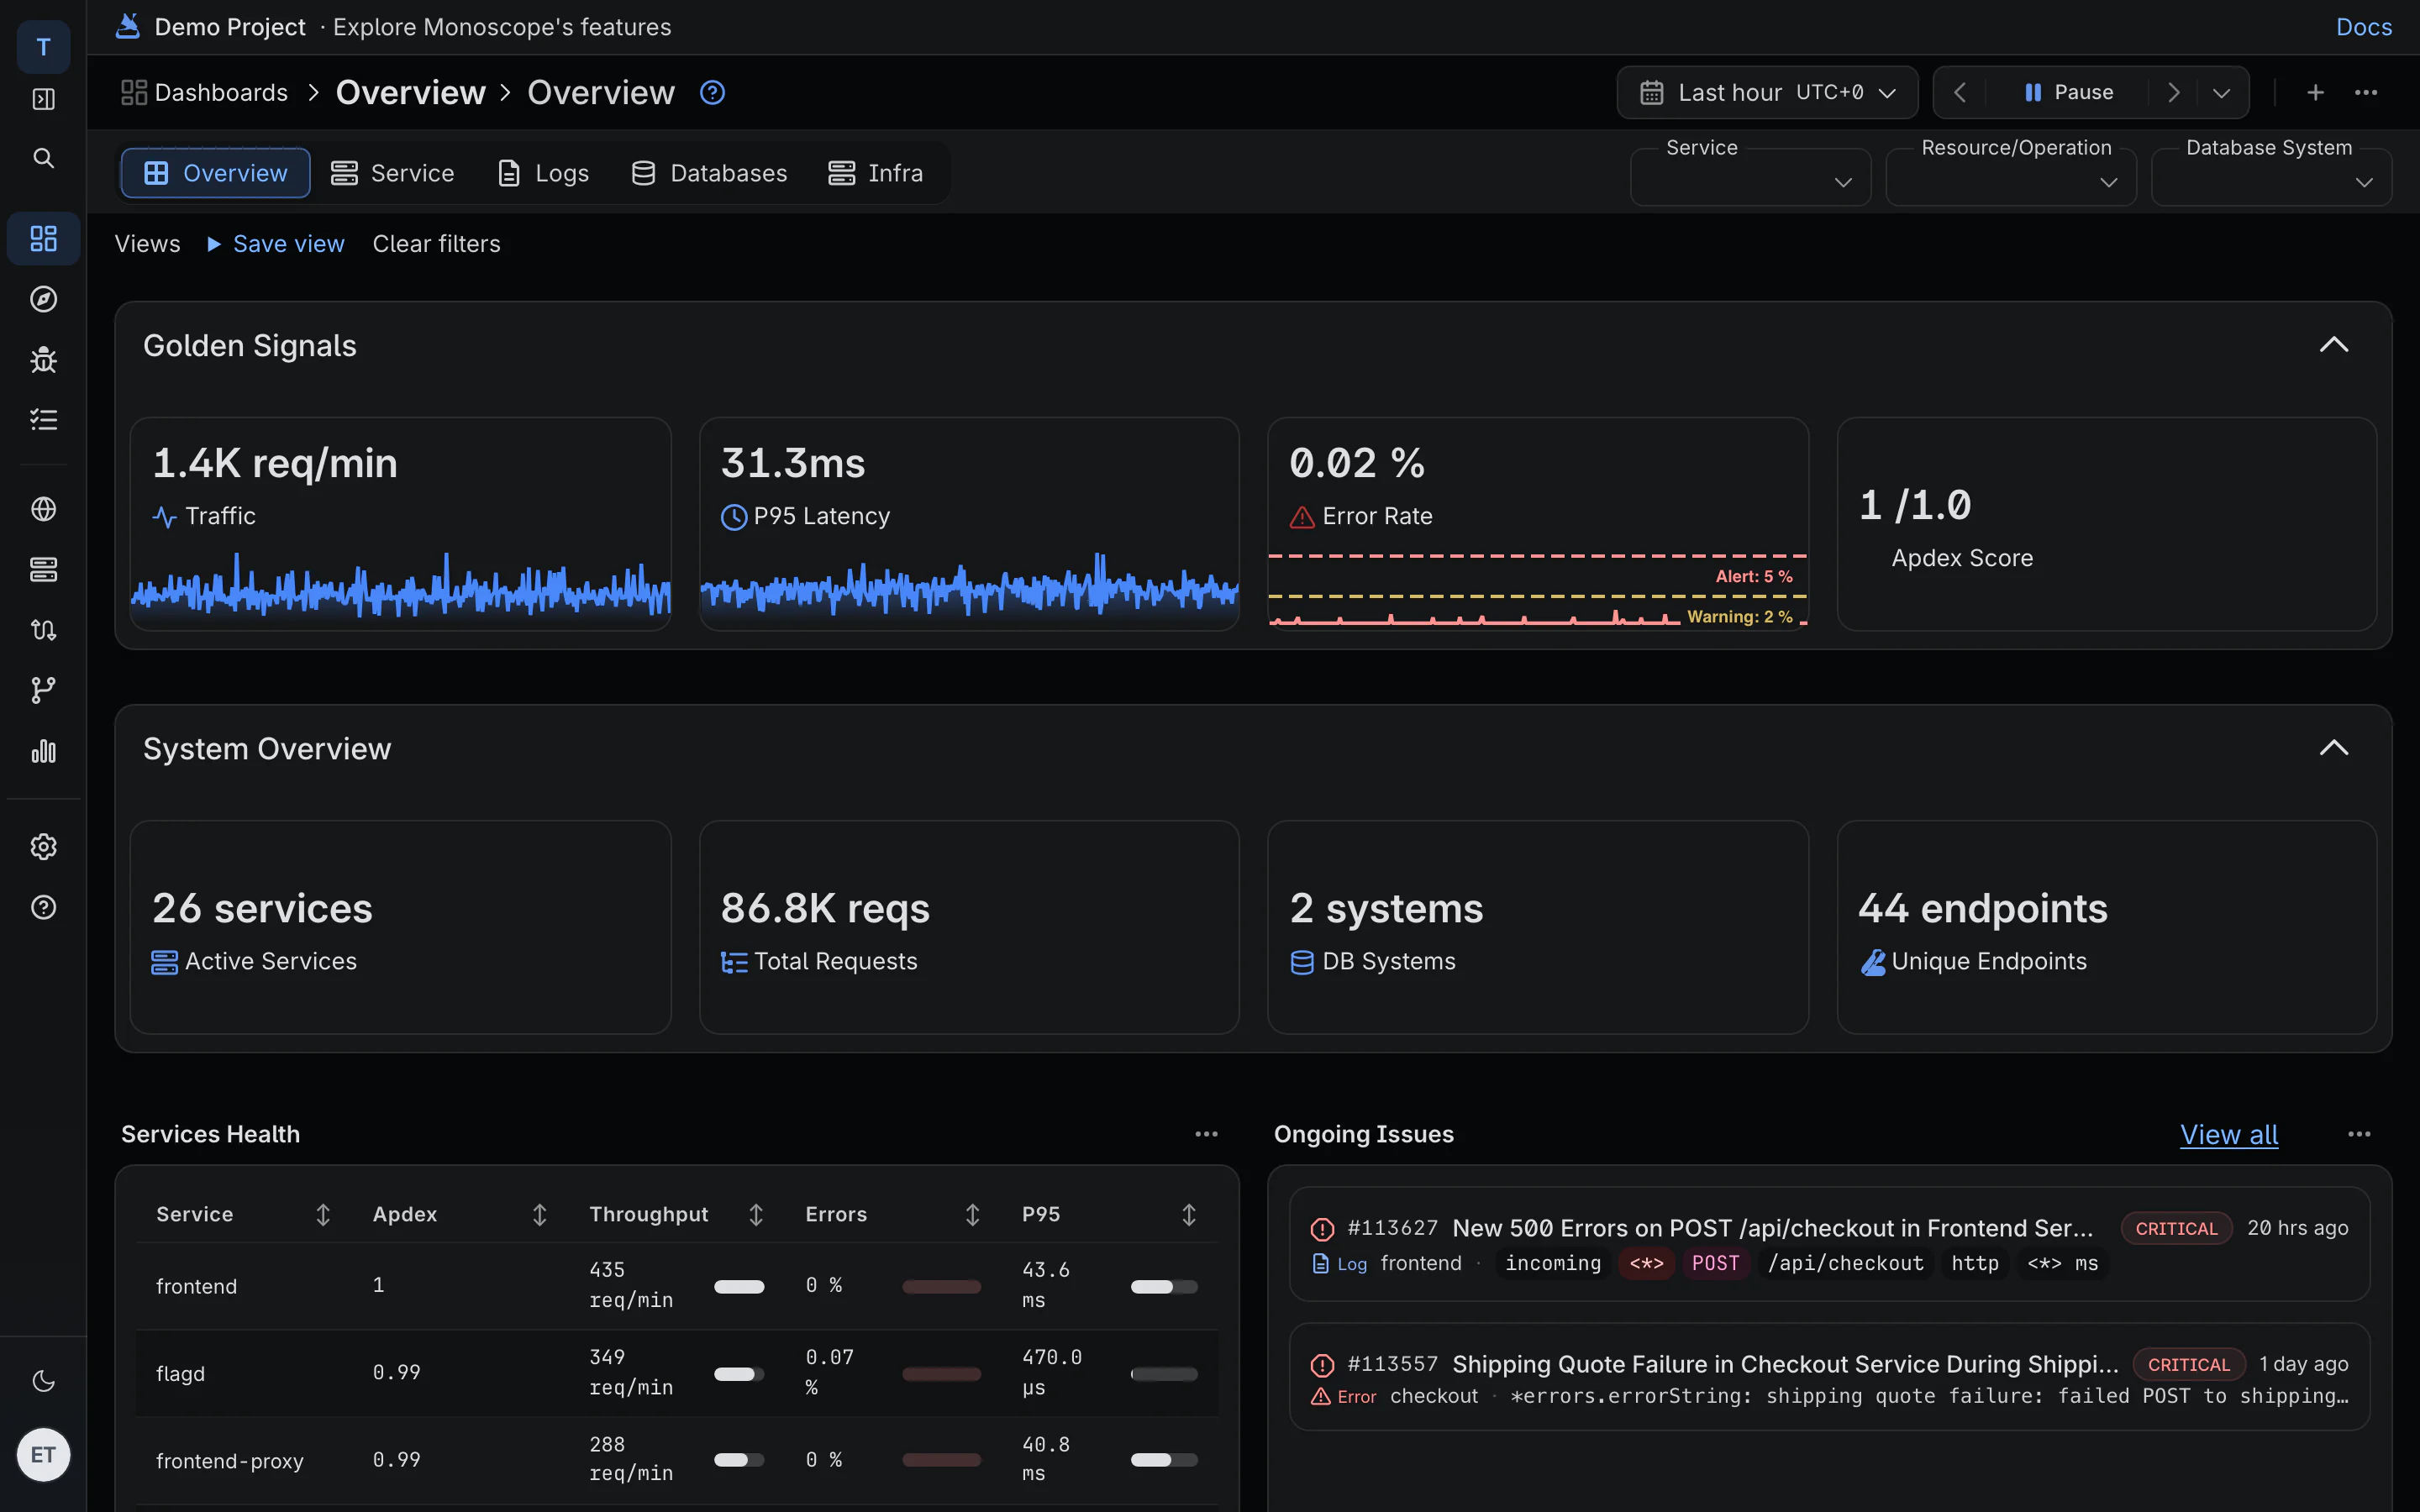
Chart latency, traffic and errors from your logs, traces and metrics. Alert on any query, and click from a spike to the requests behind it.
01 · Dashboards
Start from a template, change anything
20 templates cover Kubernetes, PostgreSQL, MySQL, Redis, nginx, RabbitMQ, Docker, the OpenTelemetry Collector and more. Every widget is a query you can open and edit.
-
Widgets that fit the question
Time series, stat, top list, table, pie, distribution, heatmap, flame graph and service map.
-
From a chart to the request
Open any widget in the Explorer to see the logs and requests behind the line.
-
Variables and saved views
Filter a whole dashboard by service or environment, and save the views your team checks every day.

02 · Alerts
Alert on any query
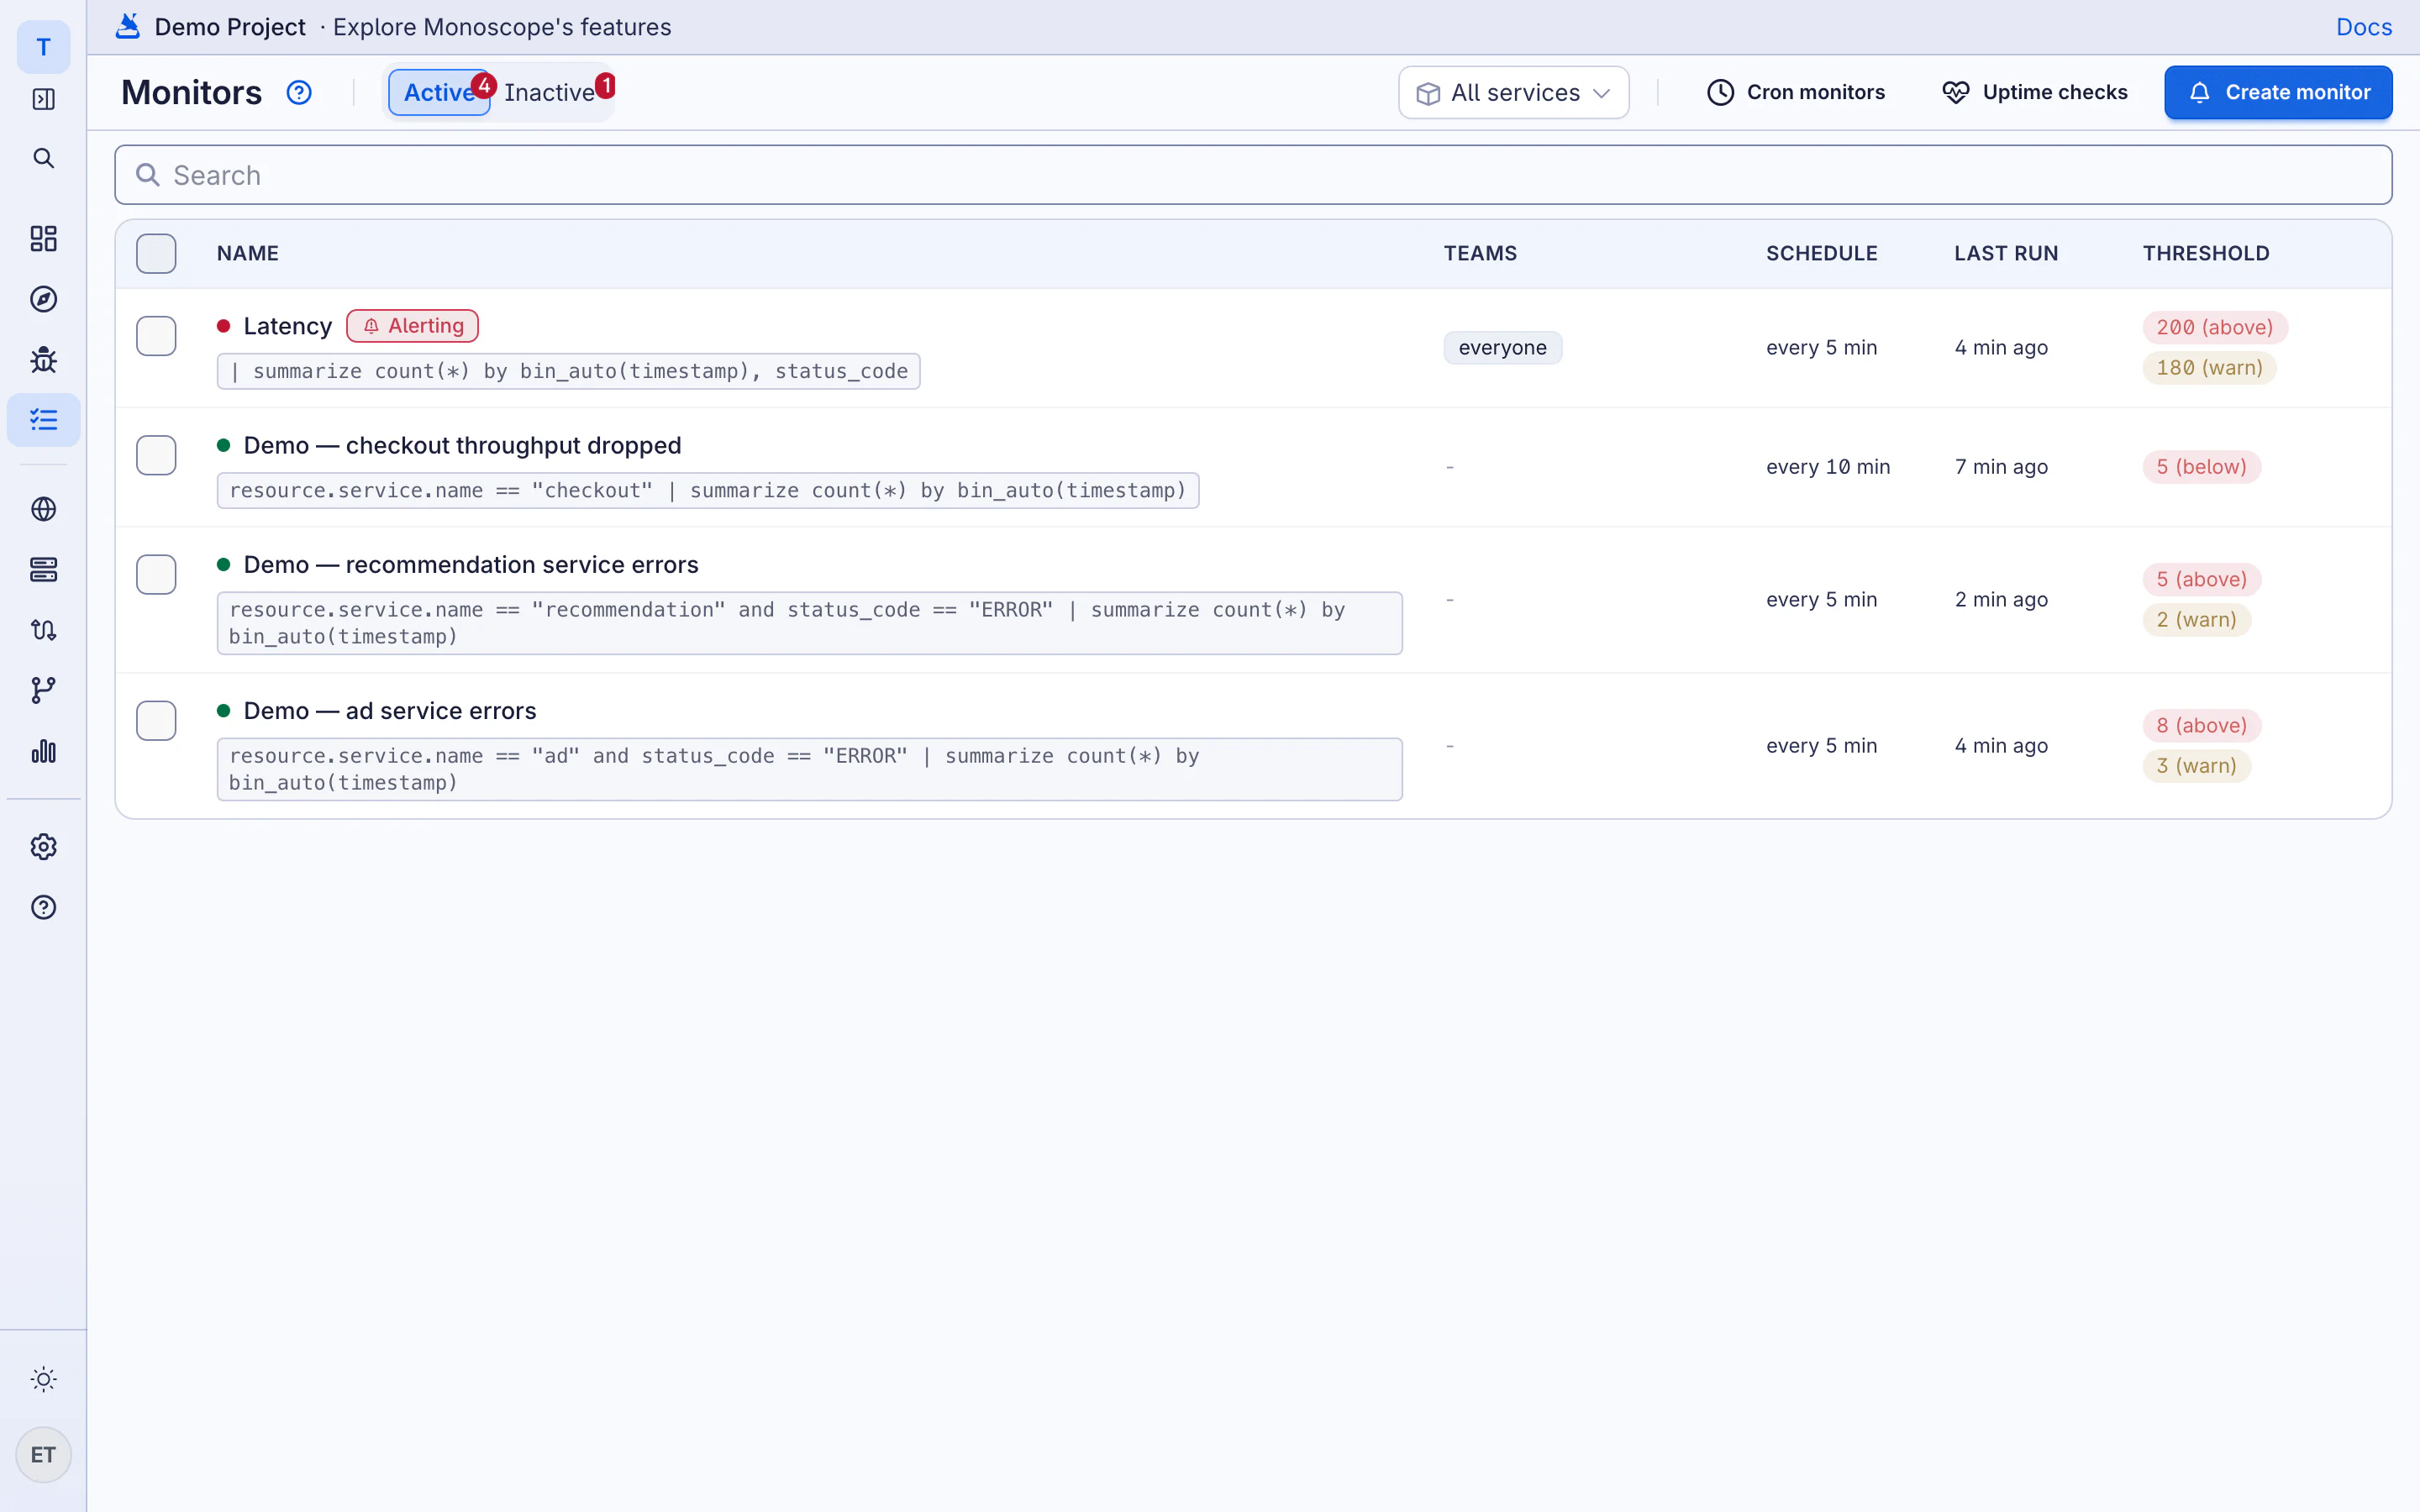
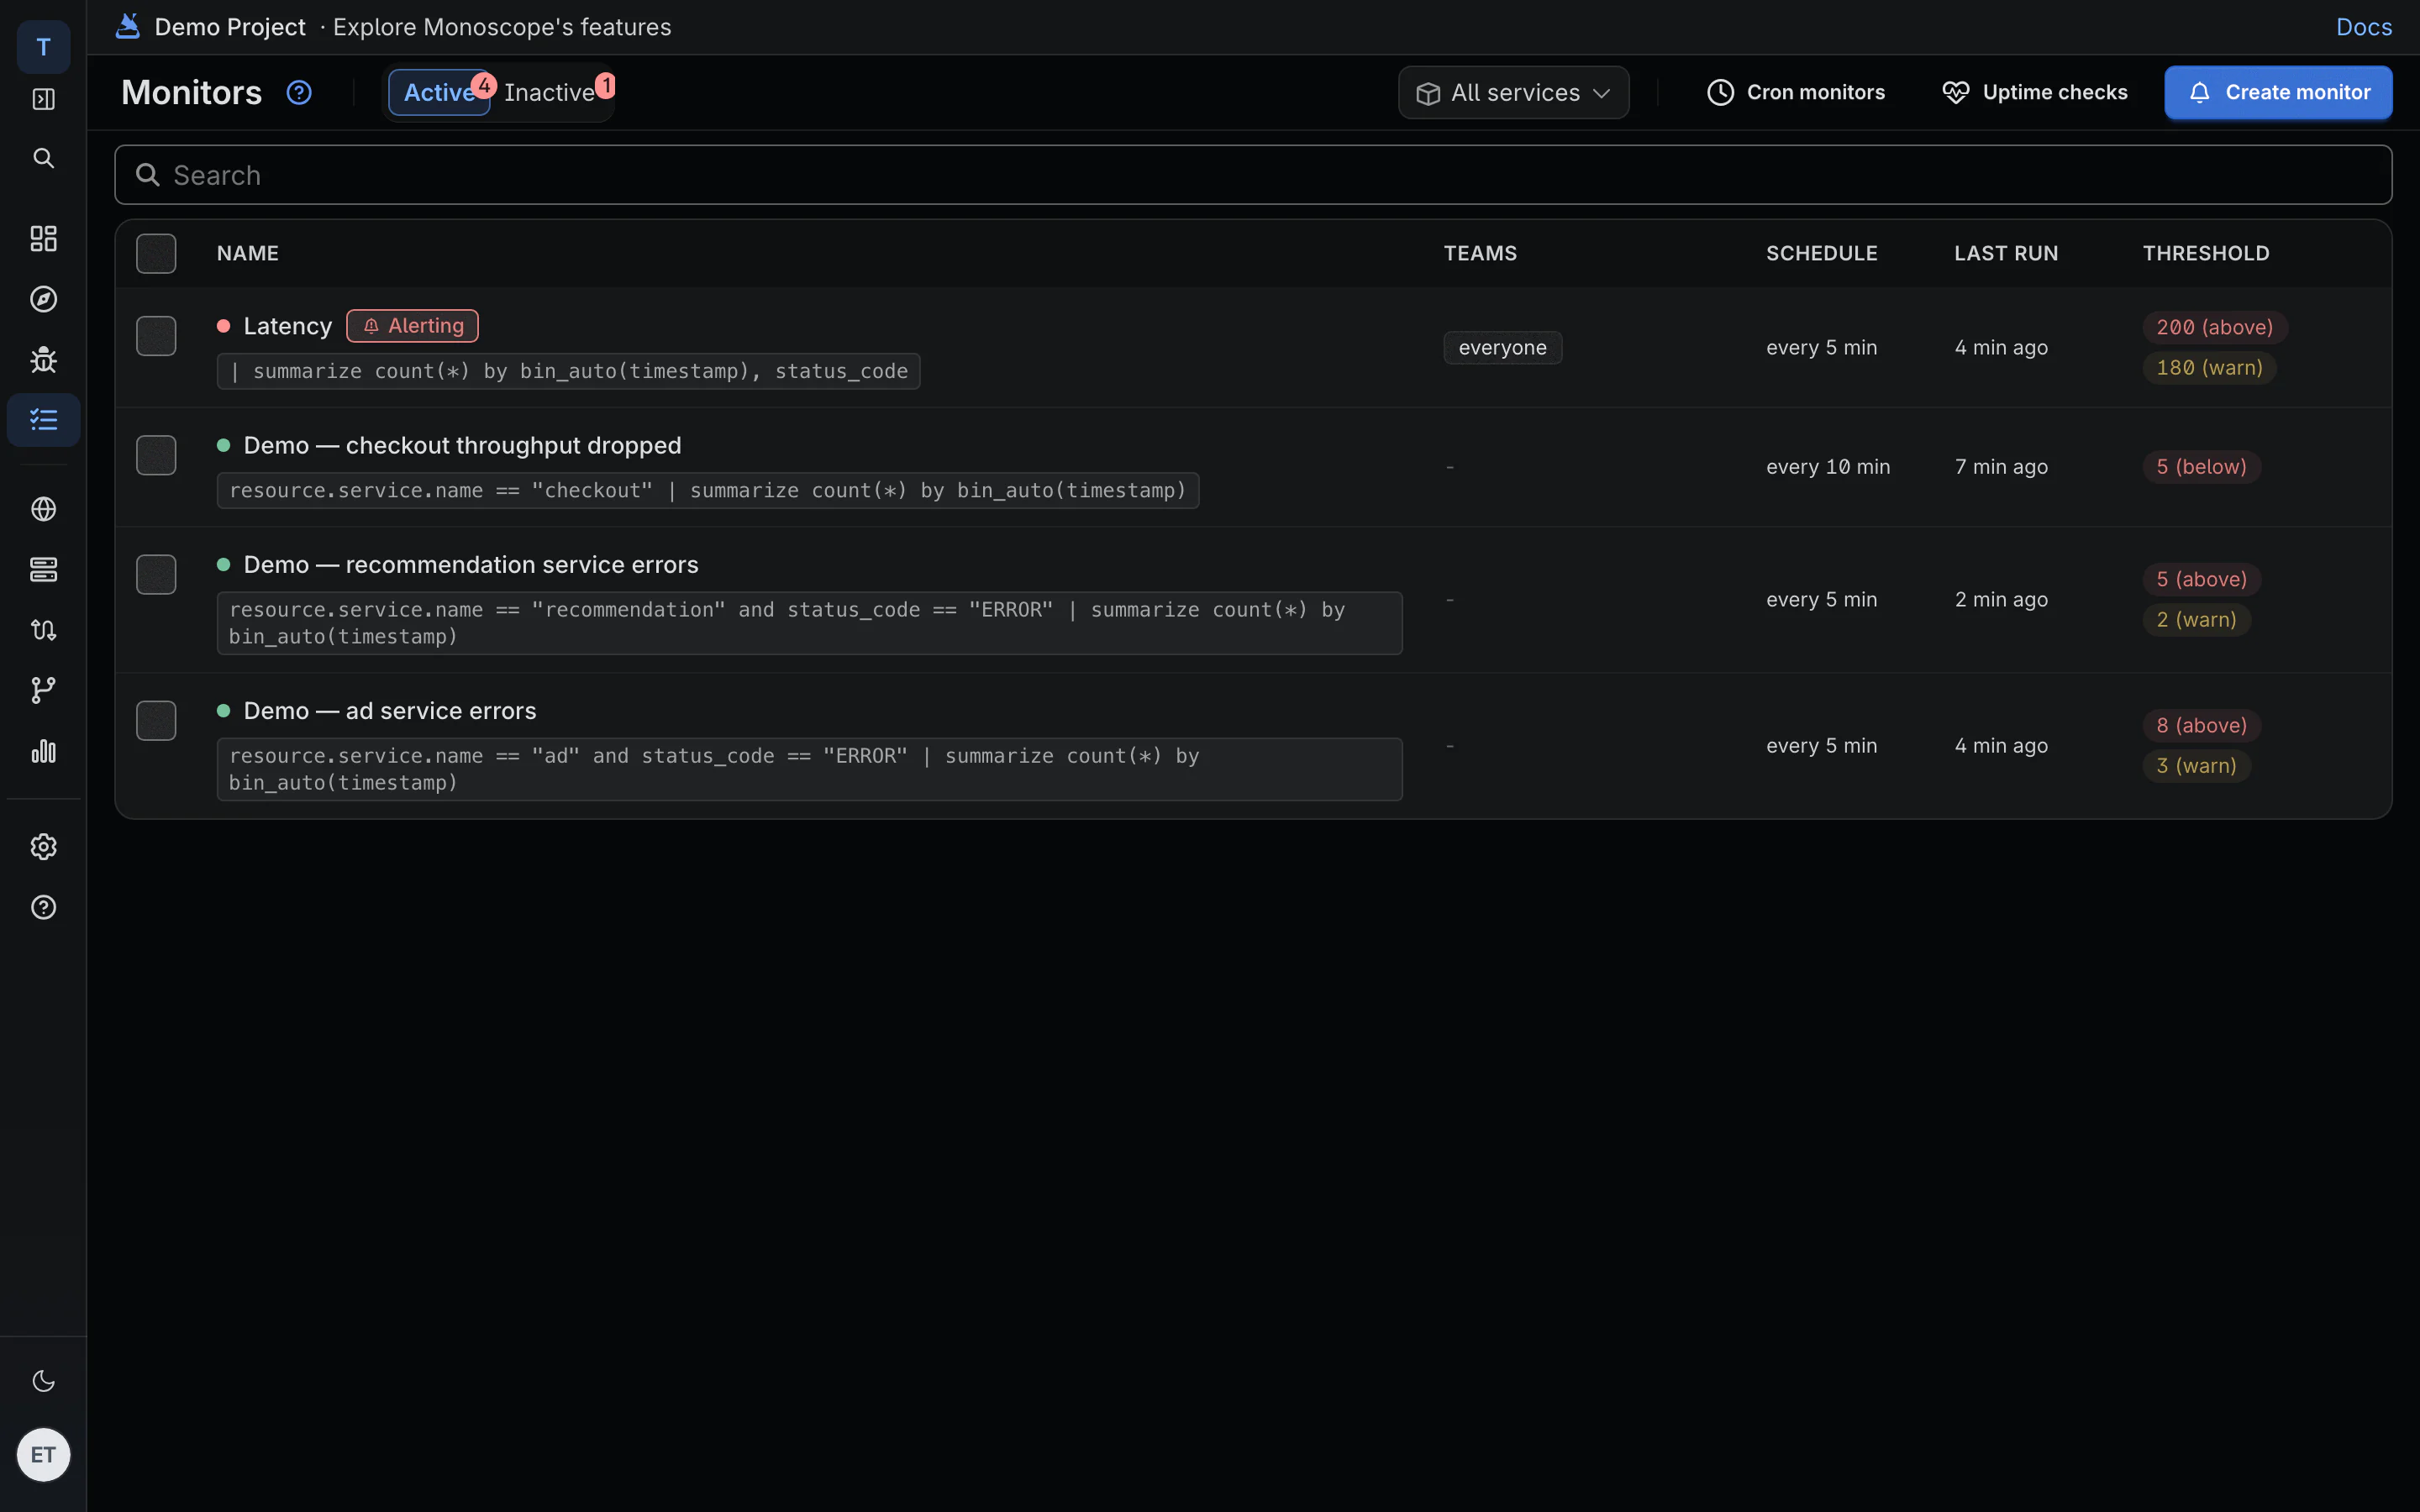
Any KQL query or dashboard widget can become a monitor. Set a warning and an alert threshold, how long it has to hold, and when to notify again.
KQL · checkout p95 latency in ms, per minute
spans
| where attributes.http.route == "/checkout"
| summarize p95(duration / 1e6) by bin(timestamp, 1m)
-
Thresholds that recover
Warning, alert and recovery levels, so a value hovering on the line doesn't page you ten times.
-
Uptime and cron checks
Probe URLs on a schedule, and know when a nightly job stops checking in.
-
Where your team already is
Slack, Discord, PagerDuty, WhatsApp and email, with the value, the threshold and a chart.
03 · Infrastructure
Hosts, containers and how services connect
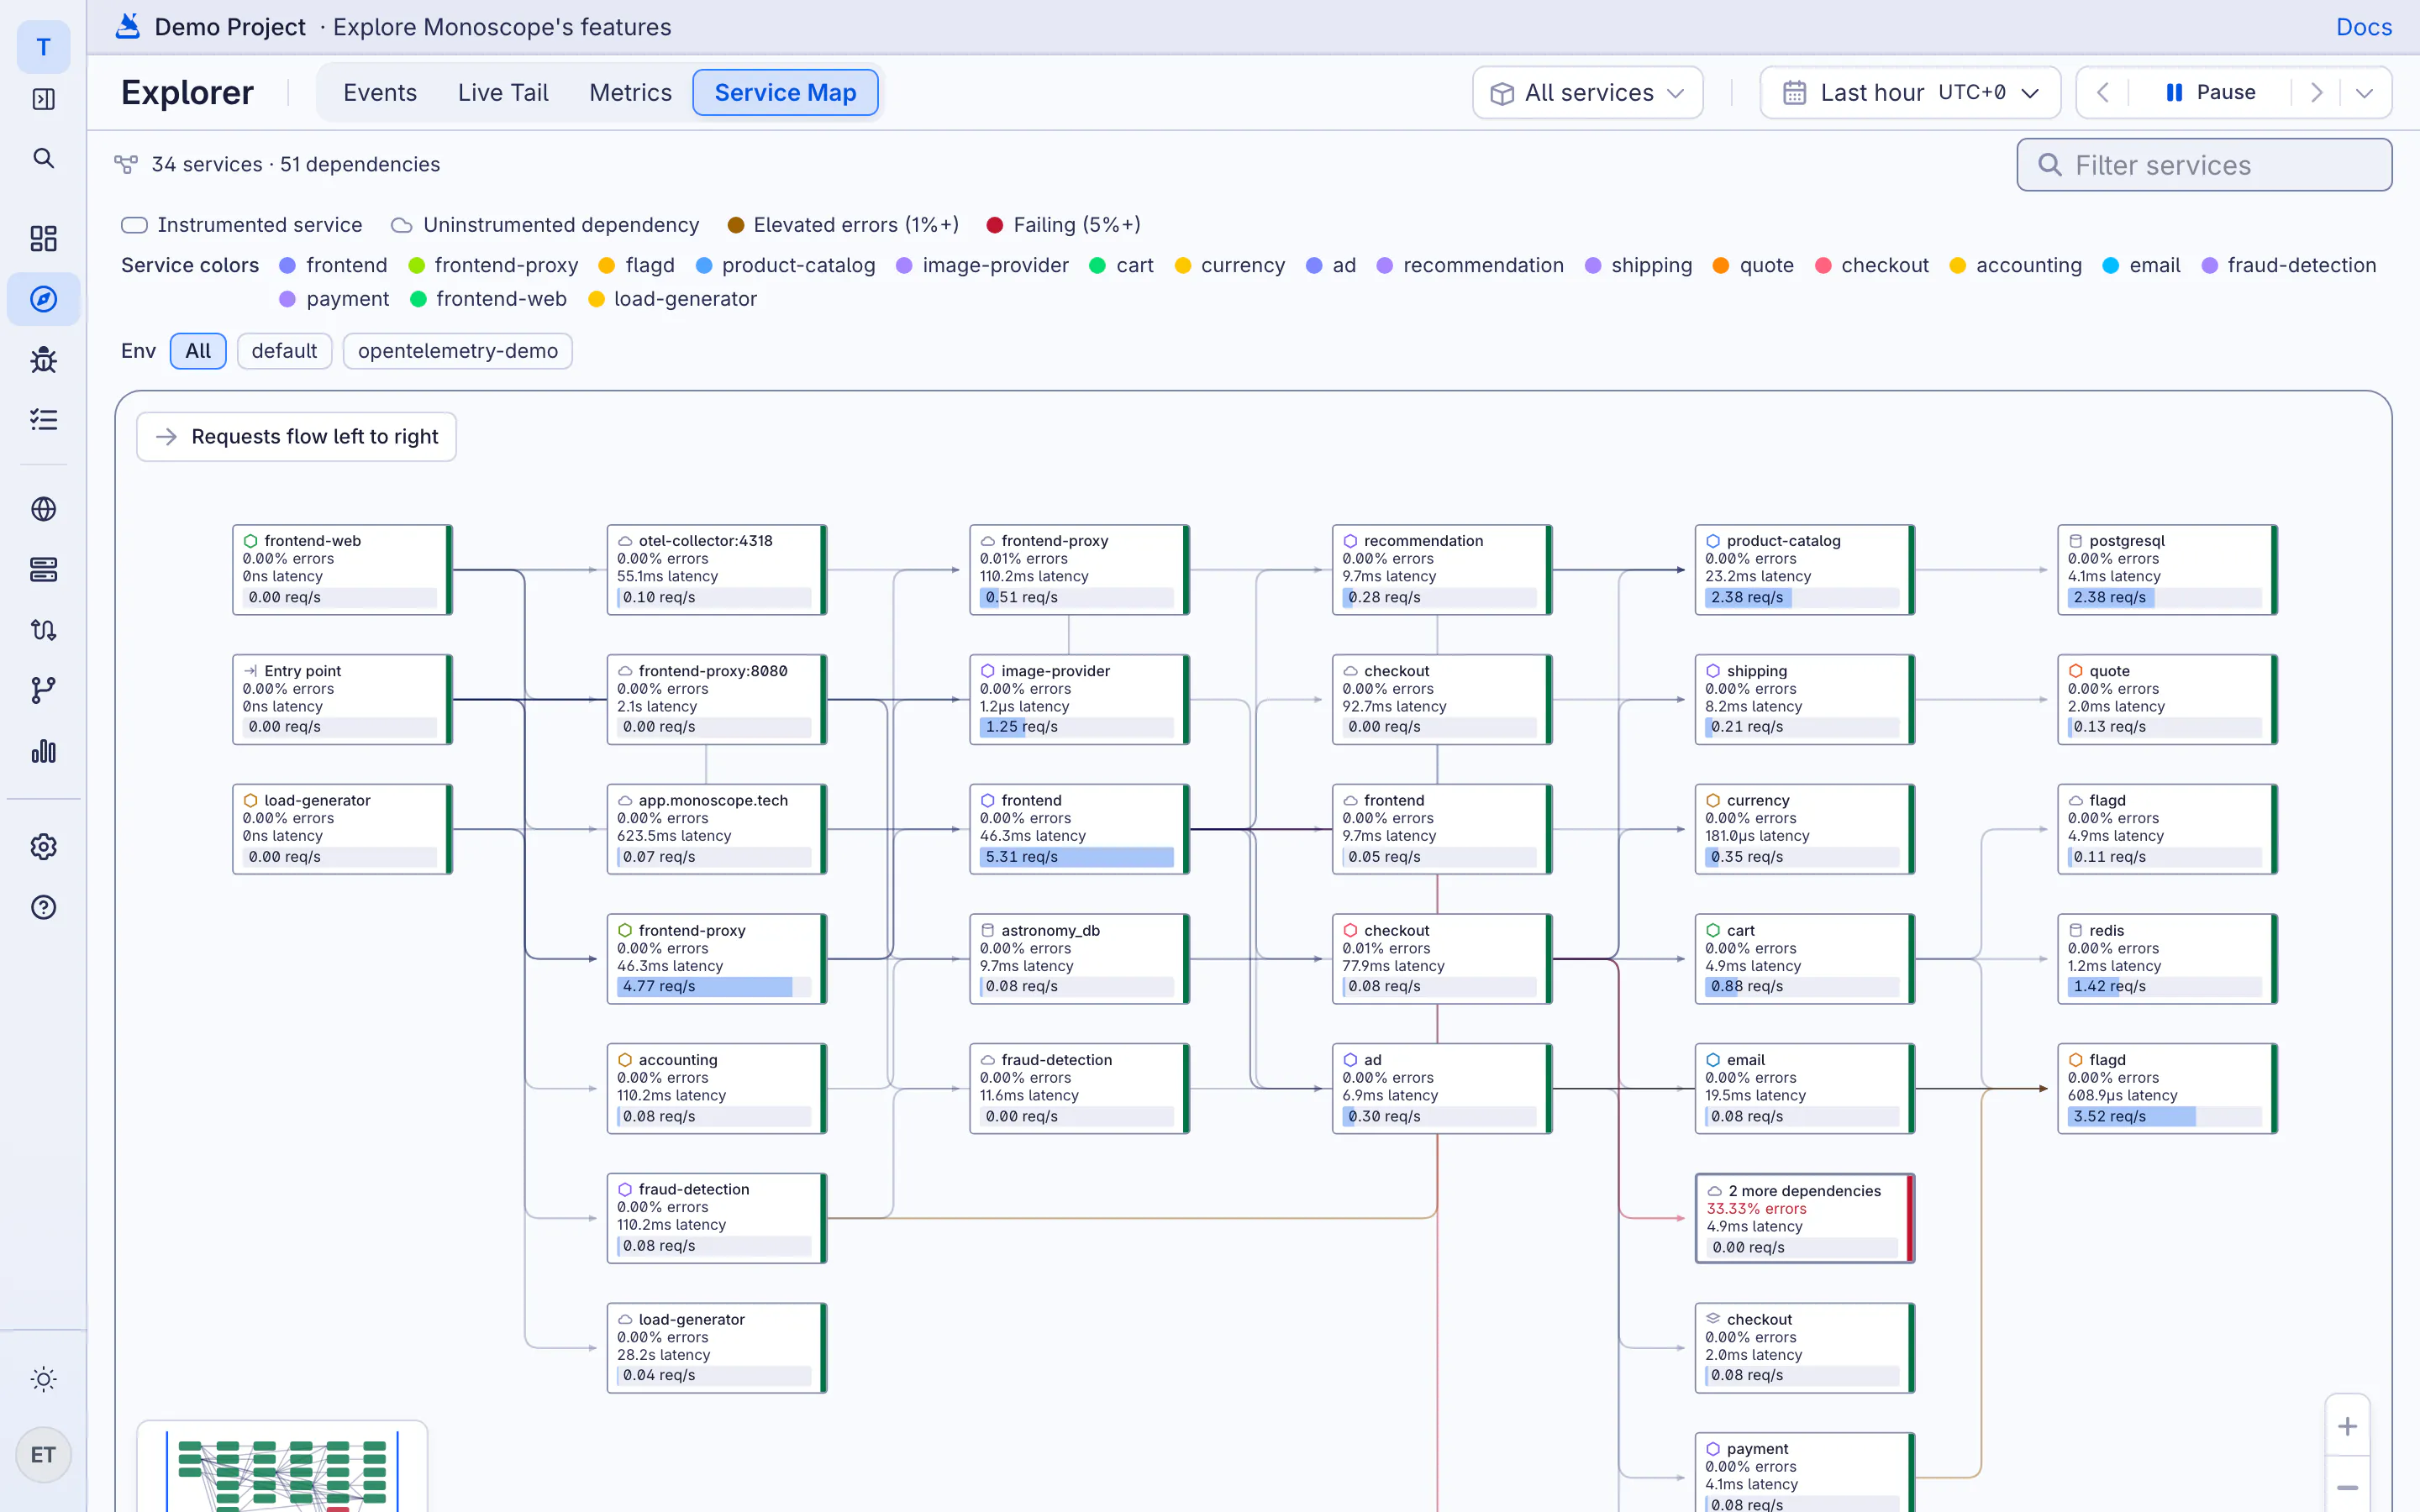
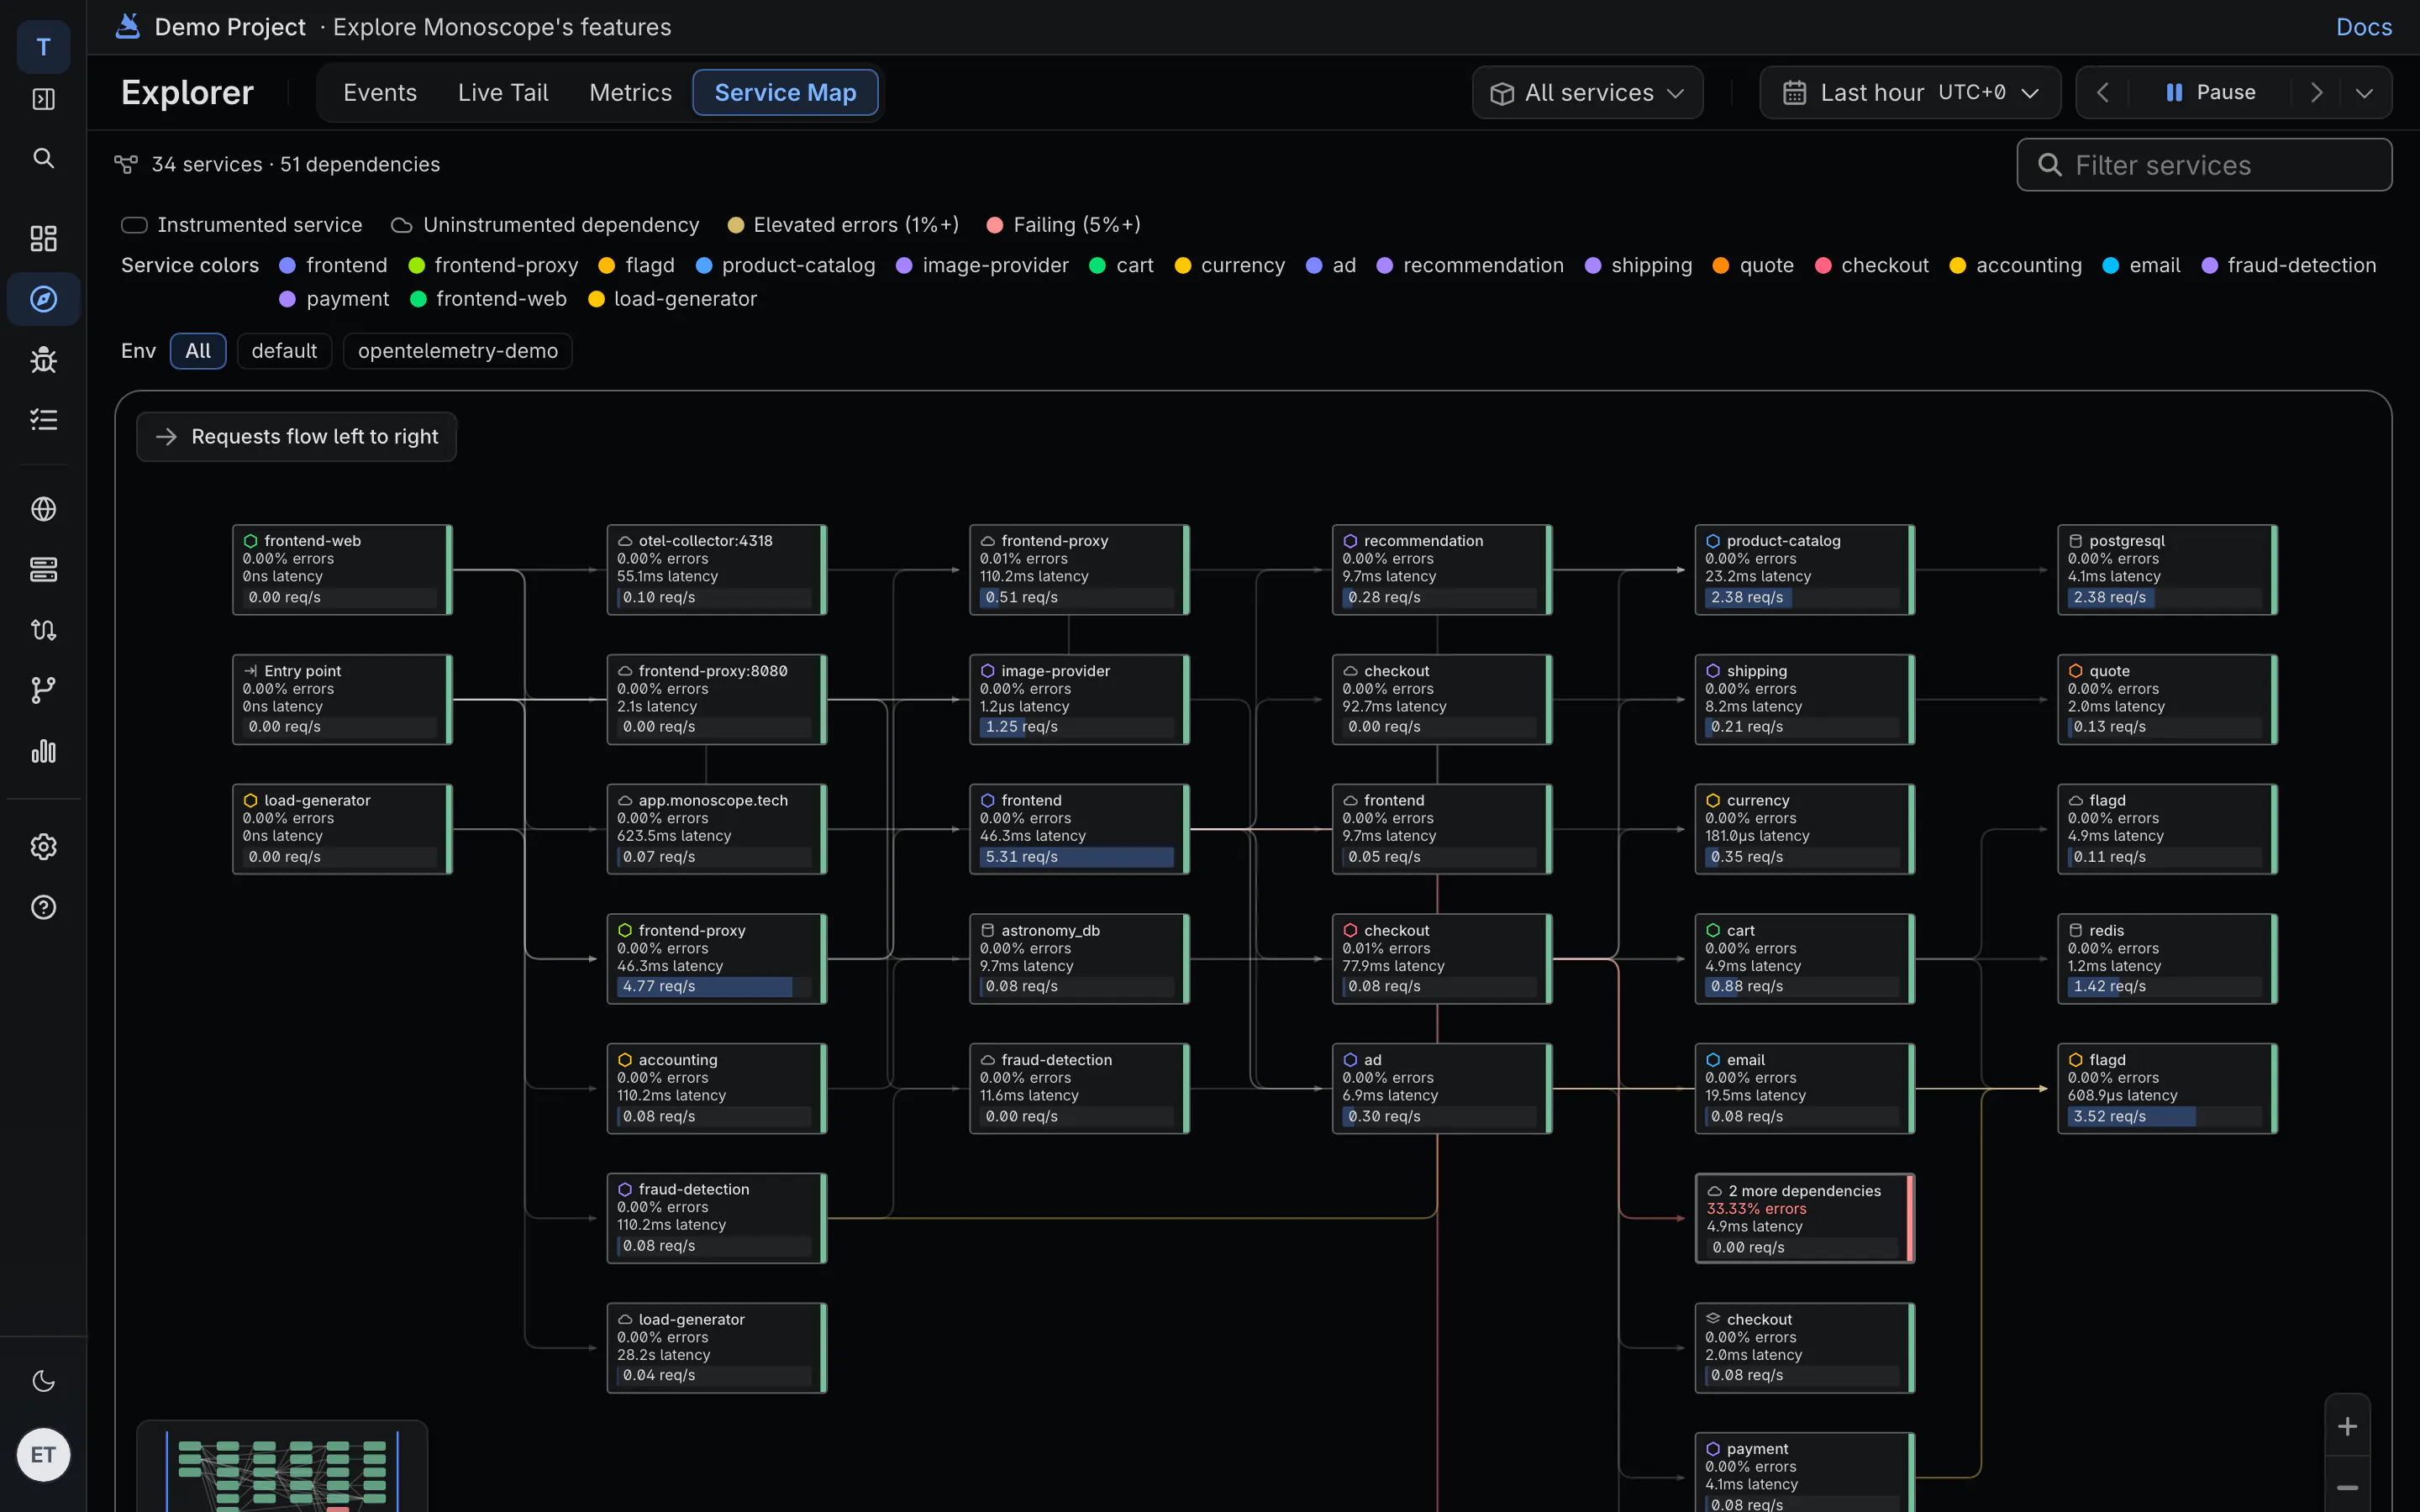
monoscope builds an inventory from the OpenTelemetry data you already send: hosts, containers, images and Kubernetes resources, plus a map of which service calls which.
-
Service map
Request rate, errors and latency per service, plus the databases, queues and third-party APIs they call.
-
Host map and containers
CPU and memory per host, pod and container, filtered by cluster, namespace or region.
-
Metrics included
20M metric datapoints a month come with Cloud, then $1 per 10M. No per-host or custom-metric fees.
04 · As code
Dashboards and monitors you can review
Export any dashboard or monitor as YAML, keep it in your repo, and apply it from CI. Changes go through a pull request like the rest of your code.
monoscope CLI
monoscope dashboards yaml <id> > dashboards/checkout.yaml
monoscope dashboards apply dashboards/
monoscope monitors apply monitors/
-
Round-trip YAML
Export, edit, apply. Applying the same file twice changes nothing.
-
Synced through GitHub
Connect a repository and dashboard and monitor changes arrive as pull requests.
-
Your agent can edit them
Claude Code and other agents manage monitors and dashboards with the monoscope CLI and skills.
Questions
Can I bring my Prometheus metrics?
Yes. Send them through the OpenTelemetry Collector, or have monoscope scrape your Prometheus endpoints.
How are metrics priced?
Cloud includes 20M metric datapoints a month; after that it's $1 per 10M. There are no host fees or custom-metric fees.
Can I move my Datadog dashboards over?
There's no automatic importer. We'll help you rebuild your key dashboards and monitors as part of moving off Datadog, at no charge.
What does an alert look like?
It shows the value, the threshold it crossed and a chart, with links to the issue and the monitor. From there the query opens in the Explorer with the matching requests.