Logs & Traces
- Field menu. One menu on every field and value: copy, filter, exclude, replace filter, group by, show patterns or add a column.
- Fullscreen. Trace and detail panels go fullscreen. Escape closes the open panel, and phones get a back button.
- Sessions list. Error sessions stand out, a client column shows browser and OS, and a Replay button is always visible.
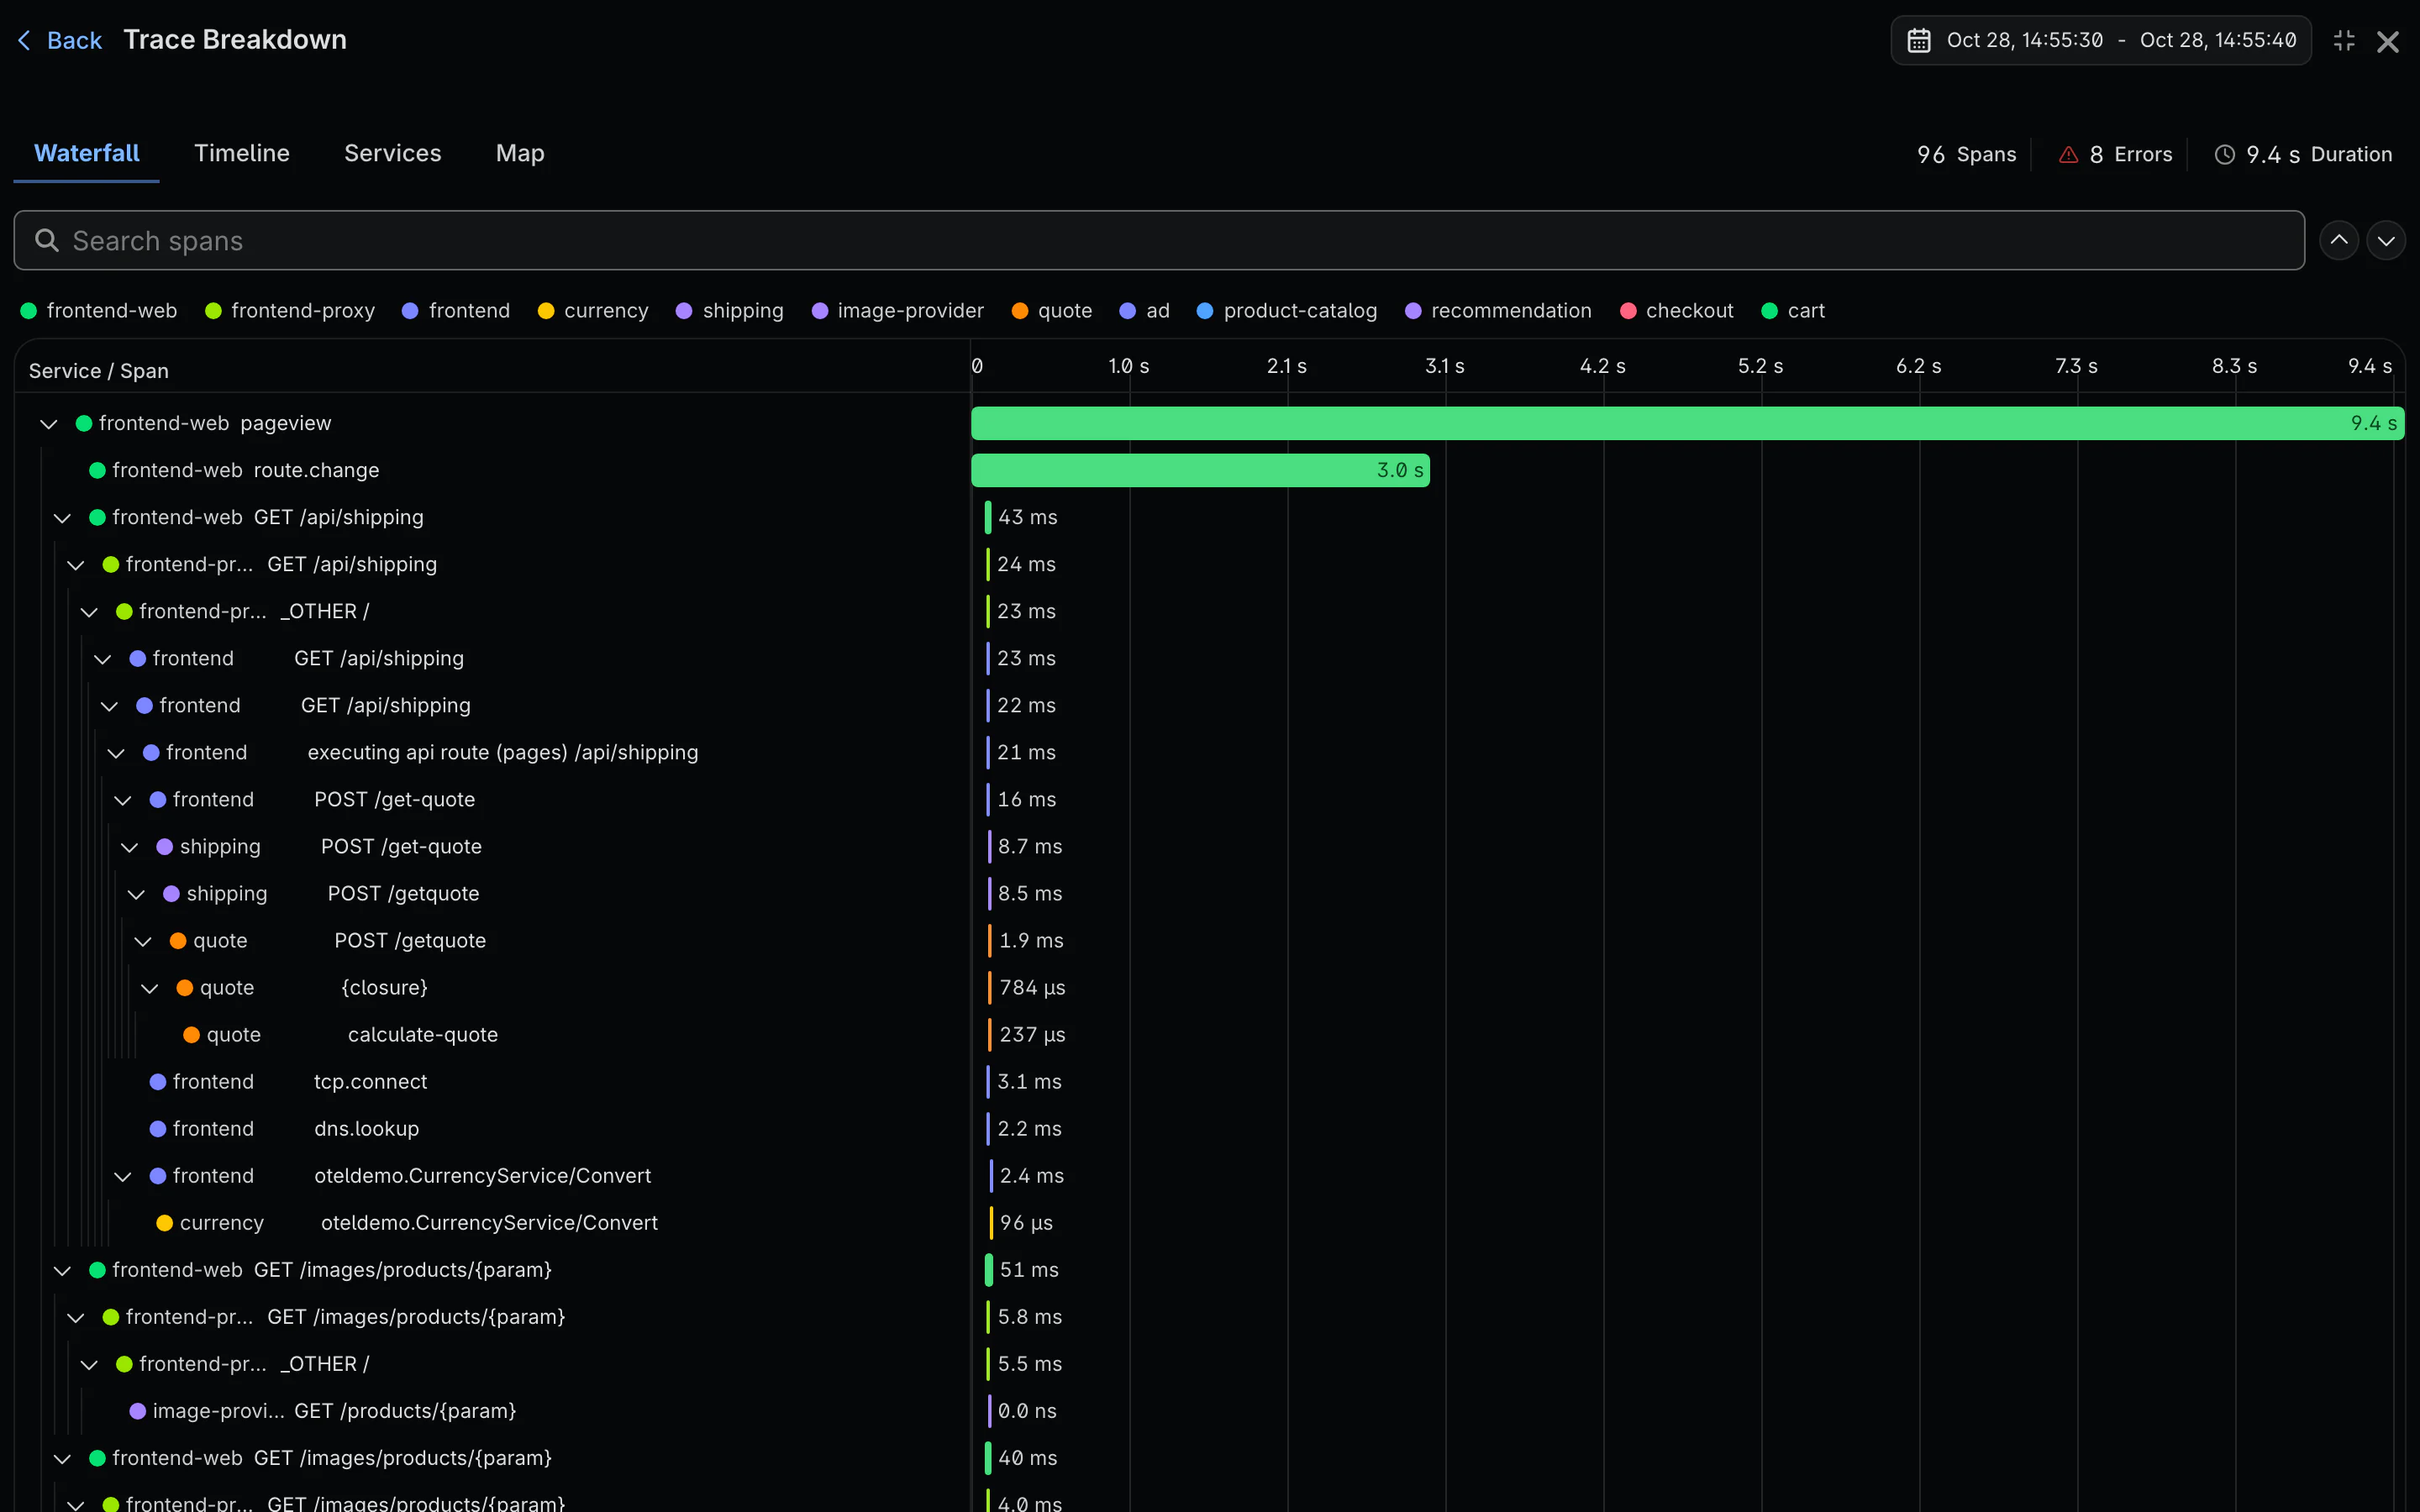
- Waterfall. Gridlines, readable duration labels and a service color legend. SDK request spans show the request and response bodies.
- Errors, not empty lists. A failed query shows the error.
-
Text search.
has,contains,startswithandendswithmatch text literally, and filters on array fields work with every operator. - The refresh button refetches, expanding a pattern shows its events, and hidden columns are saved in the URL.
Dashboards & Metrics
- Native metrics. OpenTelemetry metrics keep full histograms, exponential histograms, summaries and exemplars.
- Label breakdowns. Break a metric down by any label on its detail page and cards. Histogram charts were fixed.
- Faster dashboards. About 2 seconds instead of 7 to 9 on busy projects. Variable pickers load faster.
- API catalog. The page opens right away and fills in counts and sparklines as they load.
Session Replay
- Long sessions. Recordings up to 100 MiB are accepted, up from 10 MiB.
- Streamed playback. The player starts on the first part of a long session and streams in the rest.
- Shared replay links open the player directly, storage outages show a retryable error, and overlay text is readable in dark mode.
Issues
- Issue pages that took up to a minute now load quickly.
Integrations
- Your S3 bucket. Connection errors say what went wrong, a region picker defaults to AWS region codes, and there’s guidance for S3-compatible providers.
- The OpenTelemetry collector accepts larger payloads.
Onboarding & Billing
- Checkout calculates tax and collects a billing address and VAT ID for your invoices.
- The project picker opens correctly.
Self-Hosting
-
The Docker image has a health check on
/status. - Ingestion watches for gaps, never acknowledges a payload it couldn’t store, and no longer files spans without a project key under another project.