
OpenTelemetry
The OpenTelemetry backend that keeps the request
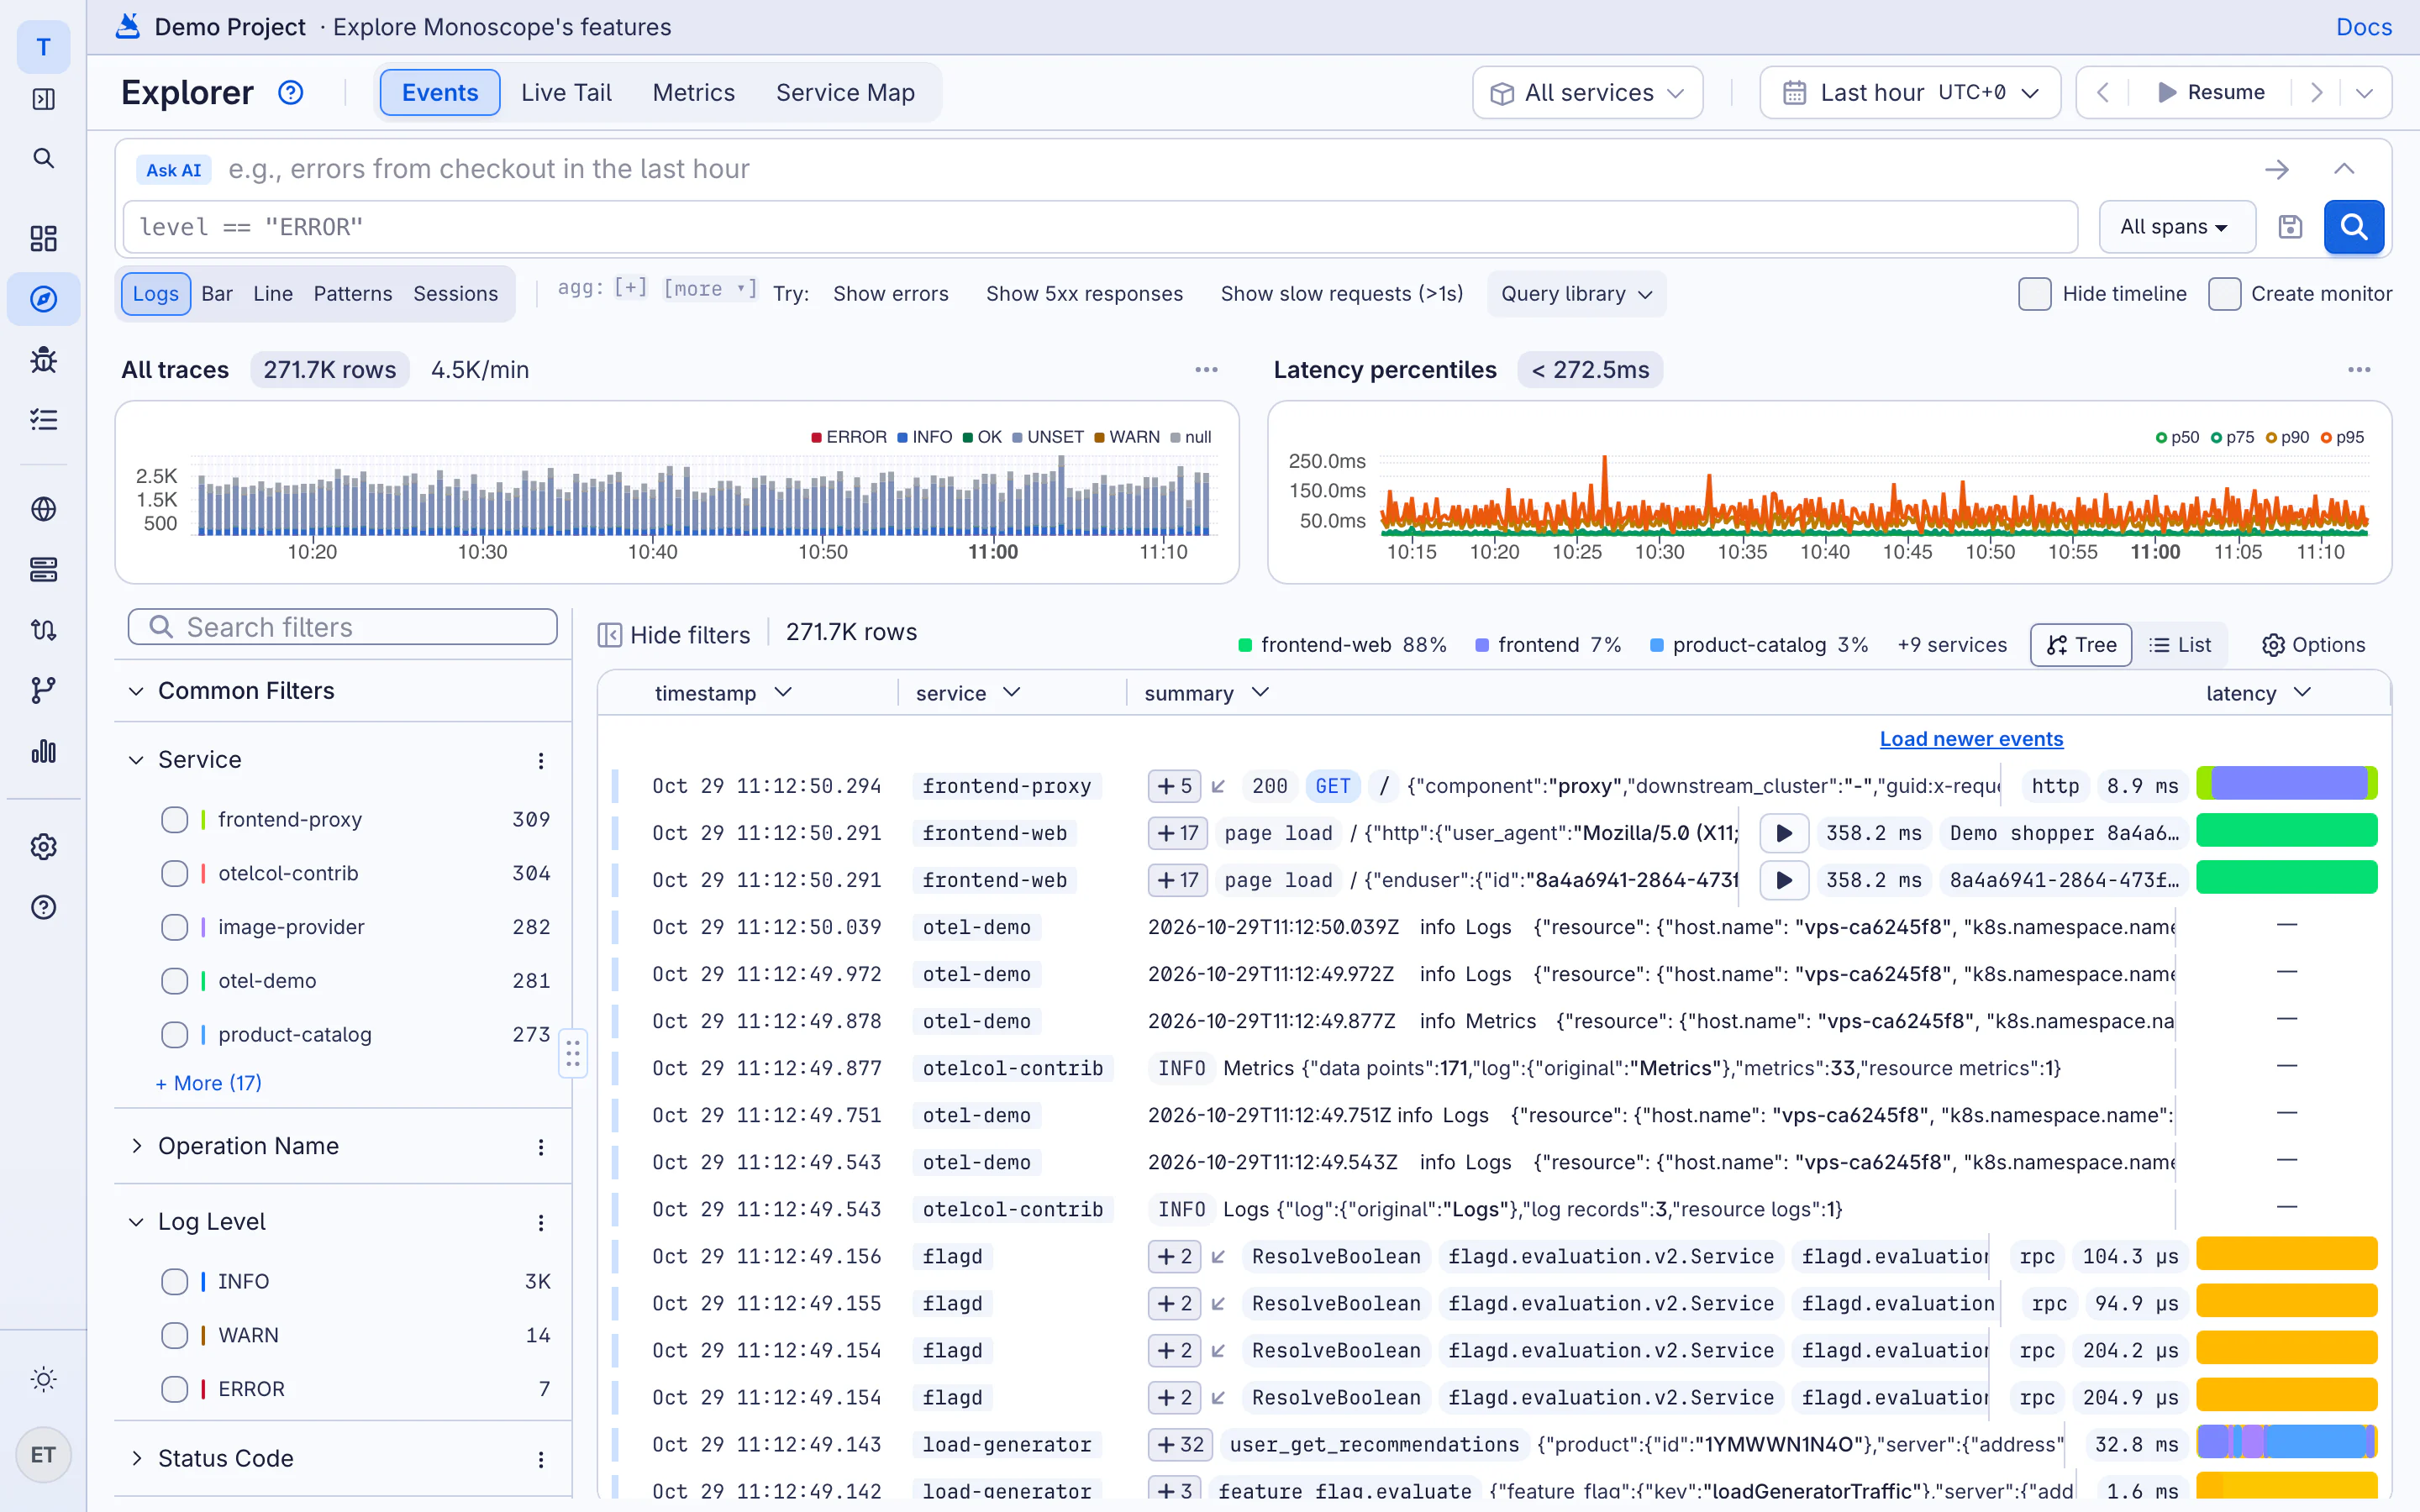
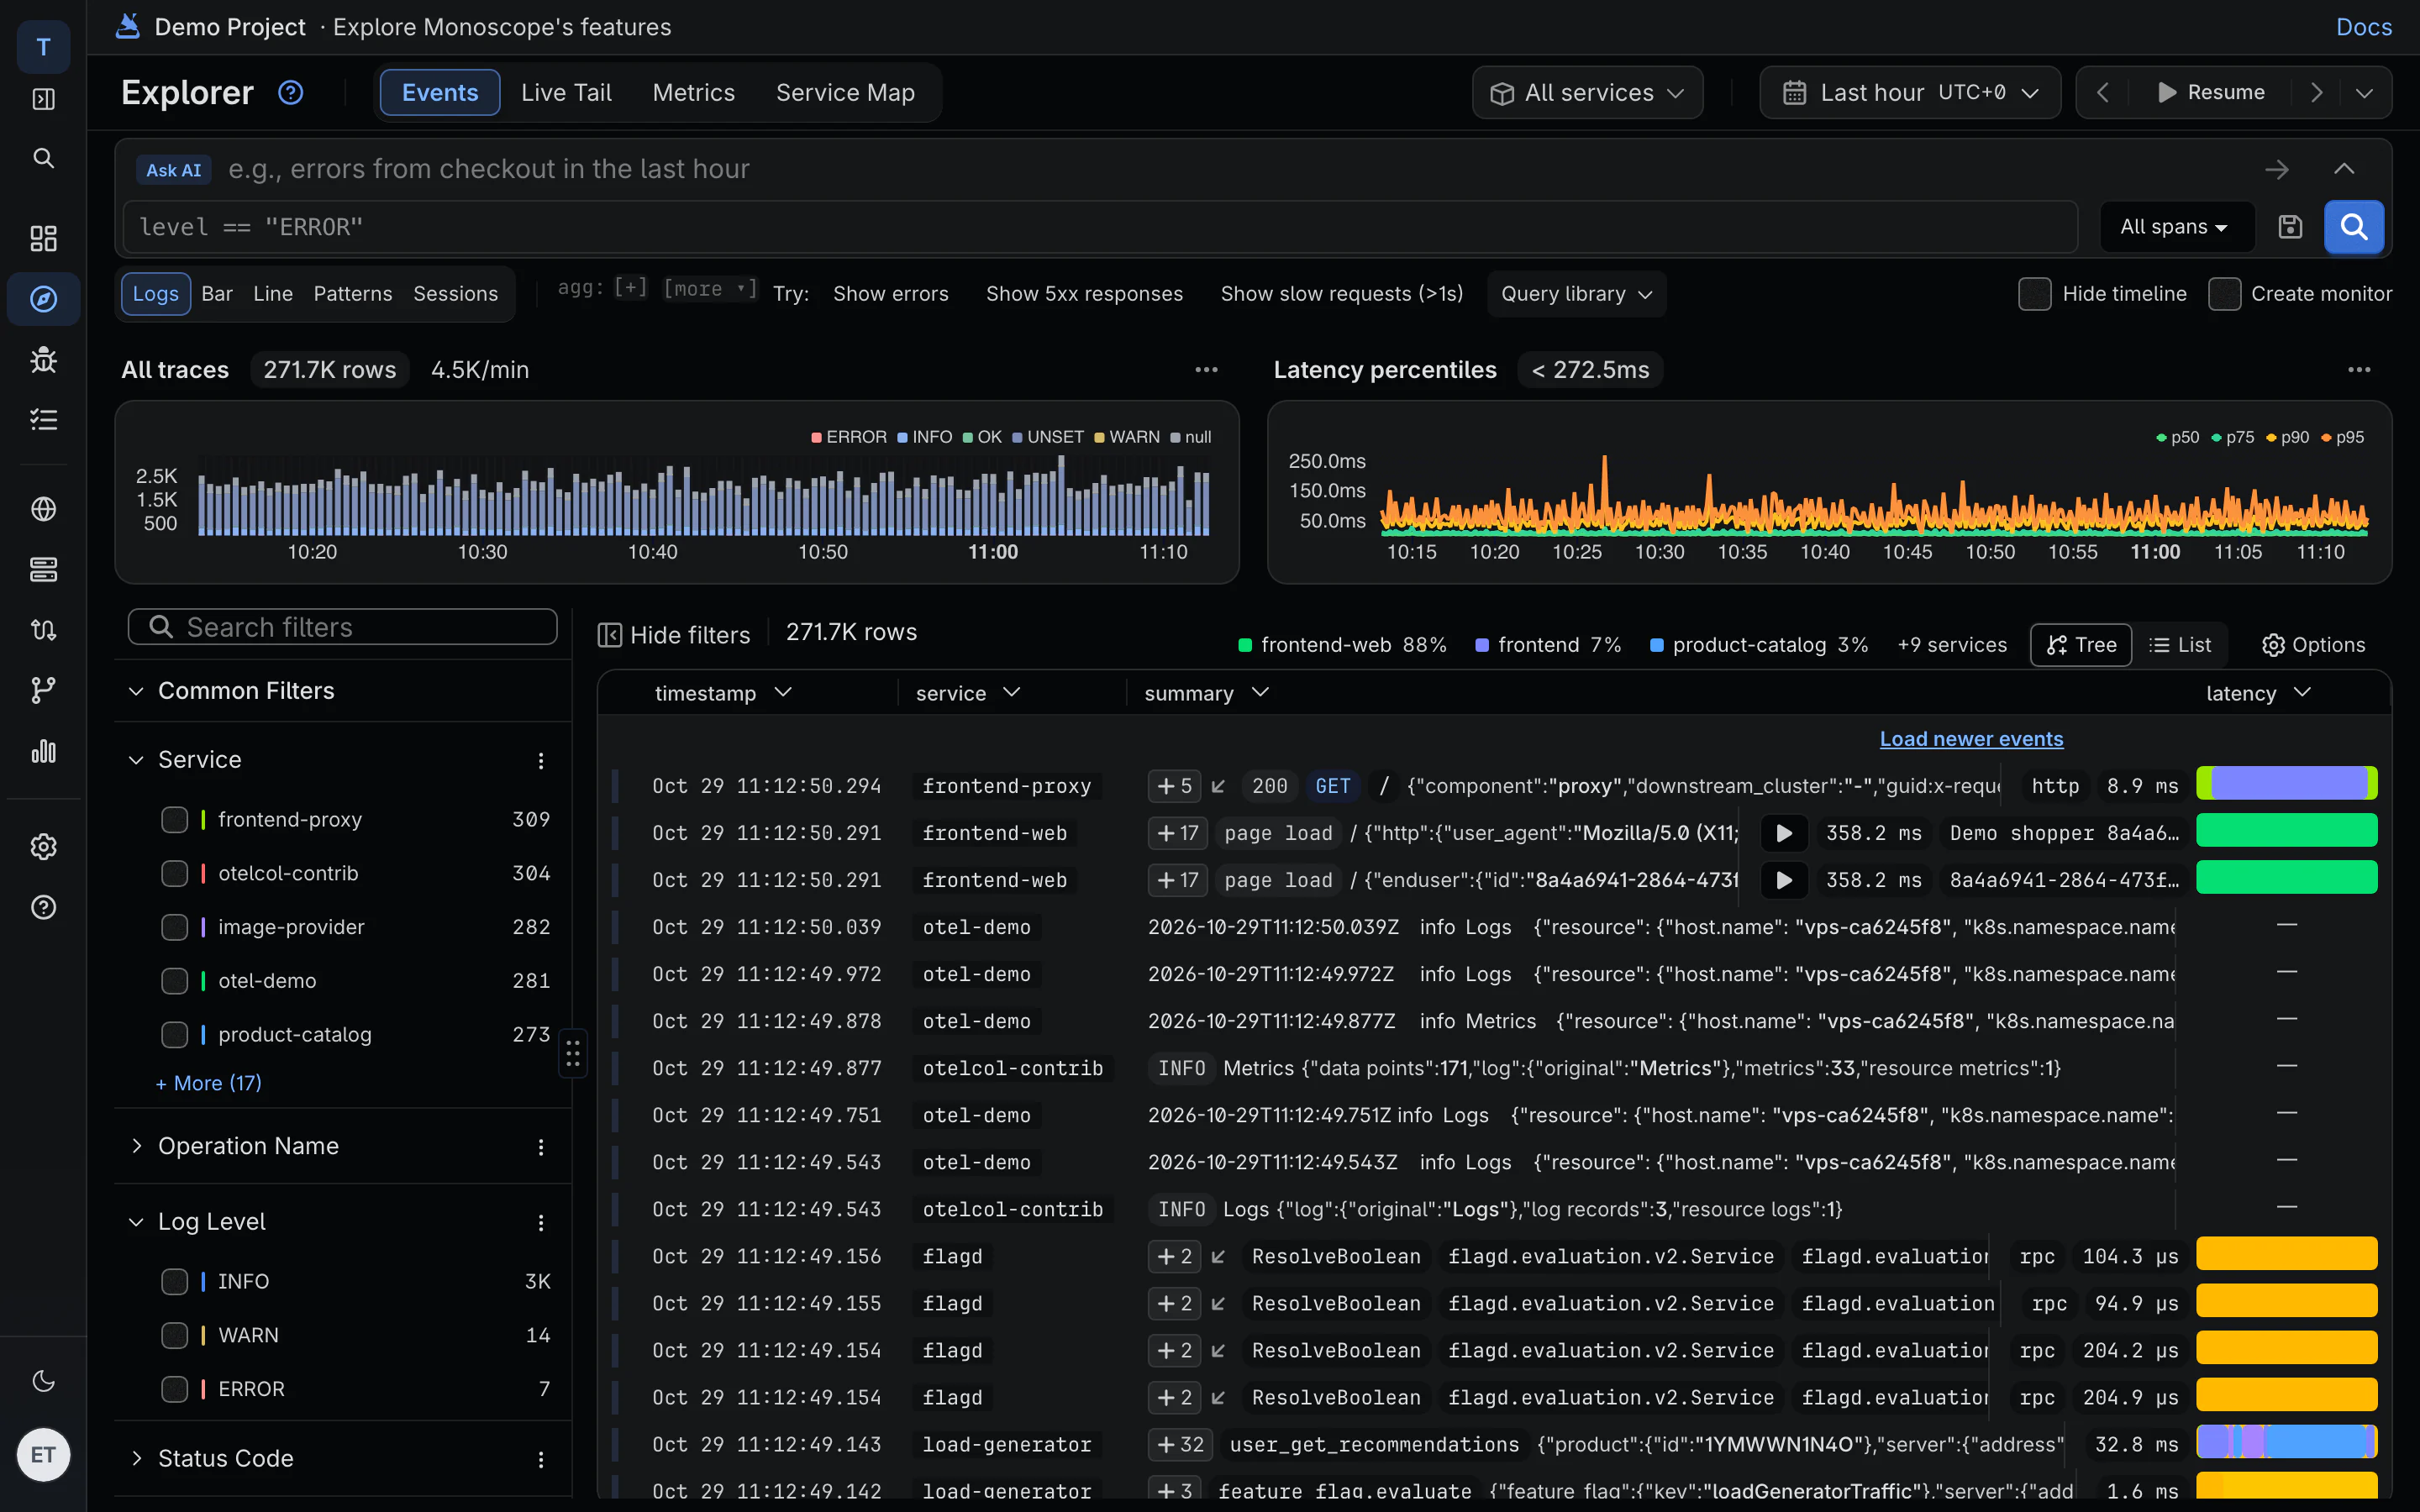
Point any OpenTelemetry SDK or collector at monoscope and your logs, traces and metrics land in one place, no proprietary agent. Add our SDK and the AI SRE also reads each request and response body.
01 · OpenTelemetry collector
One exporter change, no new agent
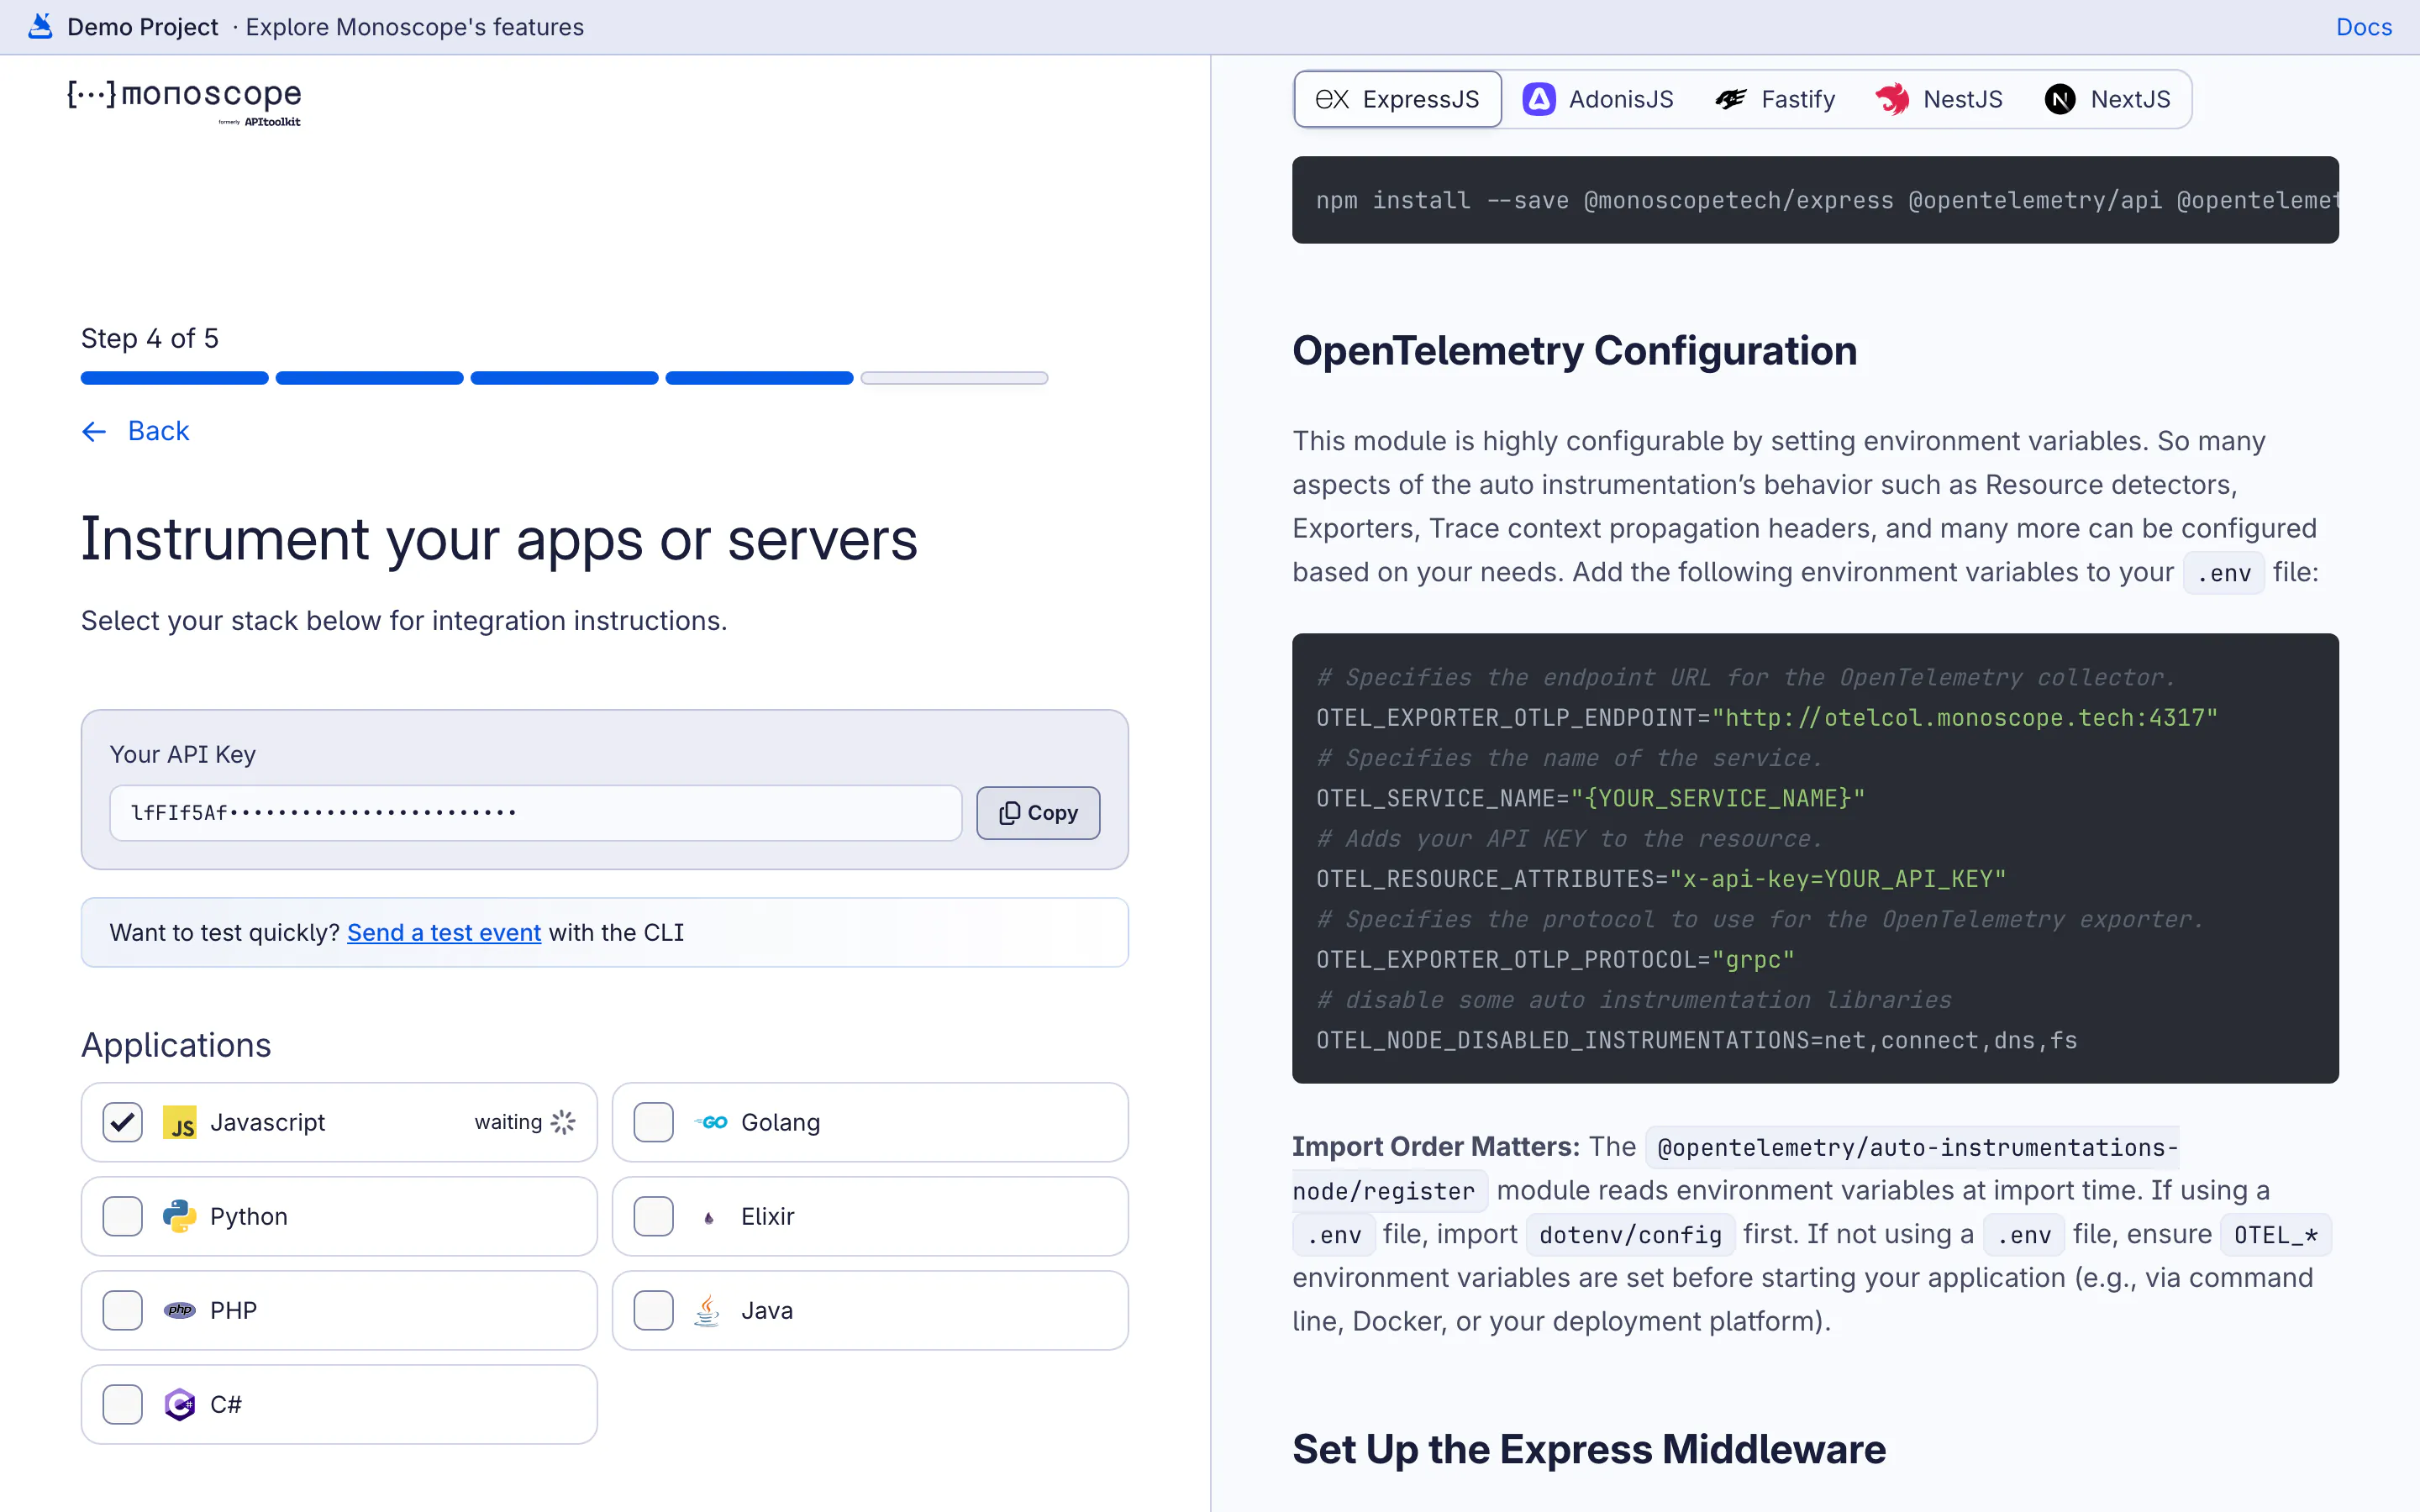
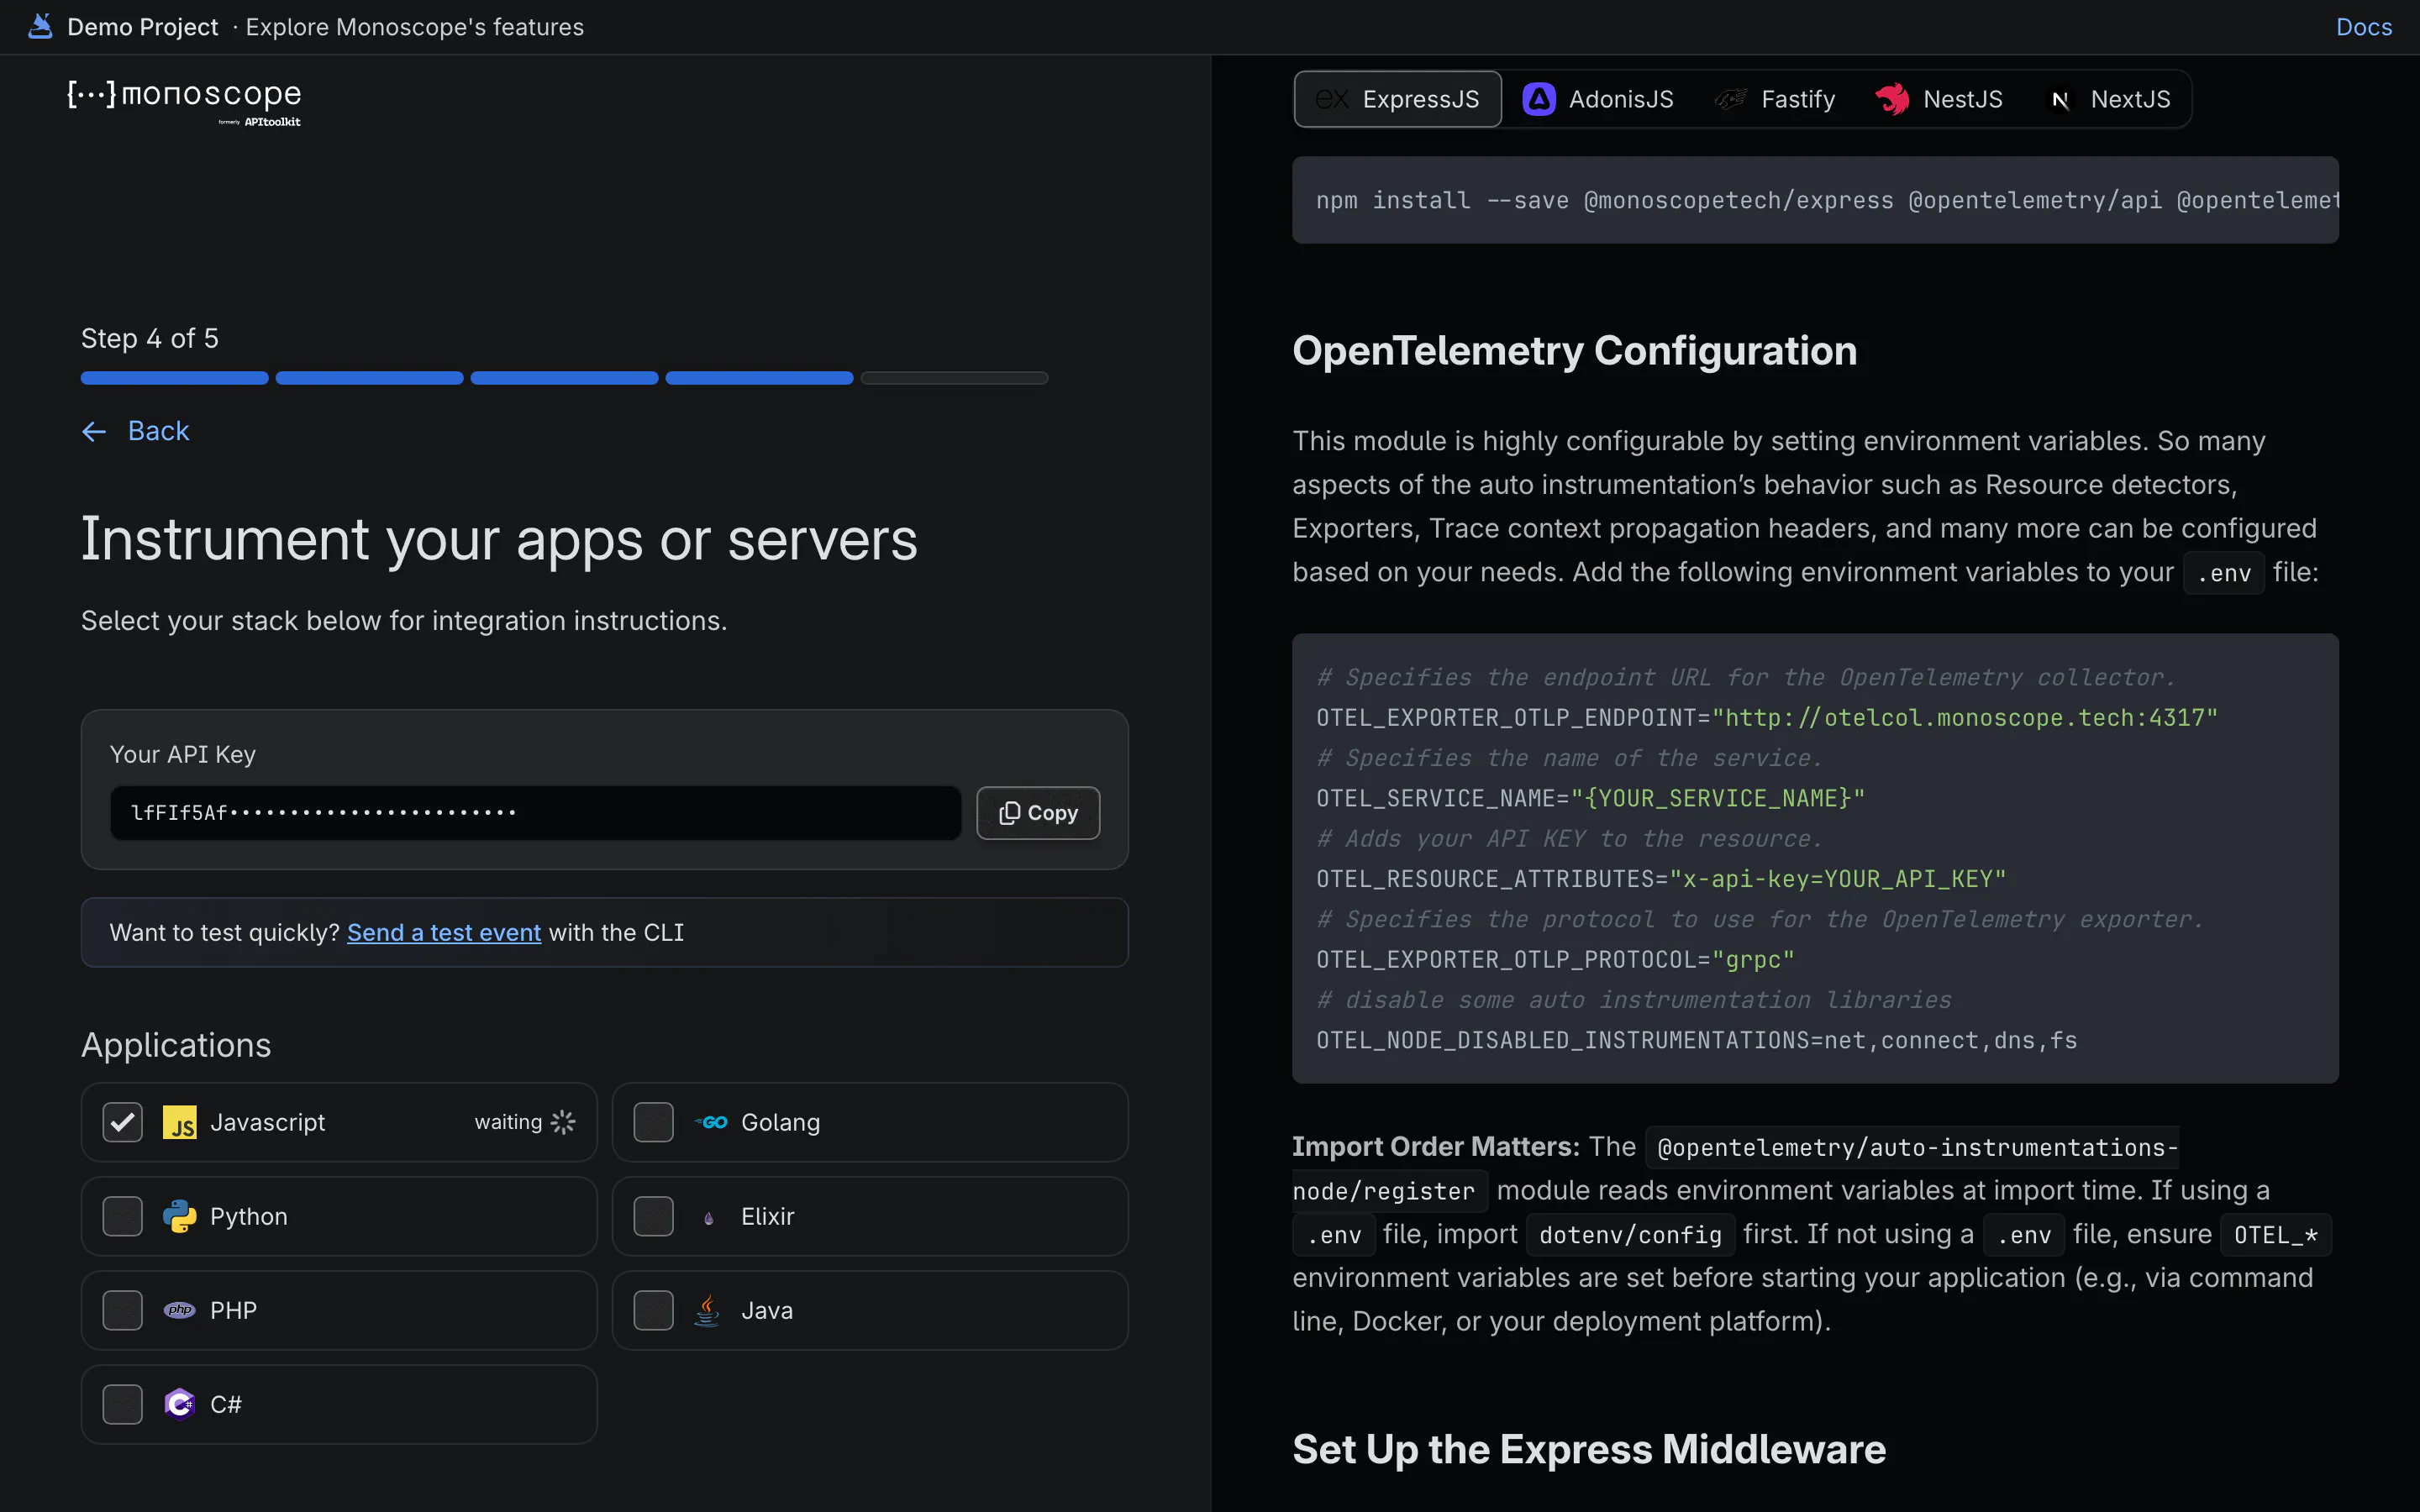
monoscope receives OTLP over gRPC on port 4317 and HTTP on 4318. Keep the collector, receivers and processors you run today, add an exporter and your API key, and data starts arriving.
otel-collector.yaml · add monoscope as an exporter
processors:
  resource:
    attributes:
      - { key: x-api-key, value: ${env:MONOSCOPE_API_KEY}, action: upsert }

exporters:
  otlp_grpc:
    endpoint: "otelcol.monoscope.tech:4317"
    tls: { insecure: true }

service:
  pipelines:
    traces:  { receivers: [otlp], processors: [resource], exporters: [otlp_grpc] }
    logs:    { receivers: [otlp, filelog], processors: [resource], exporters: [otlp_grpc] }
    metrics: { receivers: [otlp], processors: [resource], exporters: [otlp_grpc] }
-
Any language
Rust, Ruby, Scala, C++, Swift: any OpenTelemetry SDK exports straight to monoscope with four environment variables.
-
Keep your pipeline
Fan out from the same collector to monoscope and your current vendor while you compare them.
-
Prometheus too
Send Prometheus metrics through the collector, or have monoscope scrape your endpoints.
02 · One backend
Logs, traces and metrics, queried together
Logs and spans share one table, so a log line sits inside the trace that wrote it. Metrics are queried in the same KQL, and any query becomes a dashboard widget or a monitor.
-
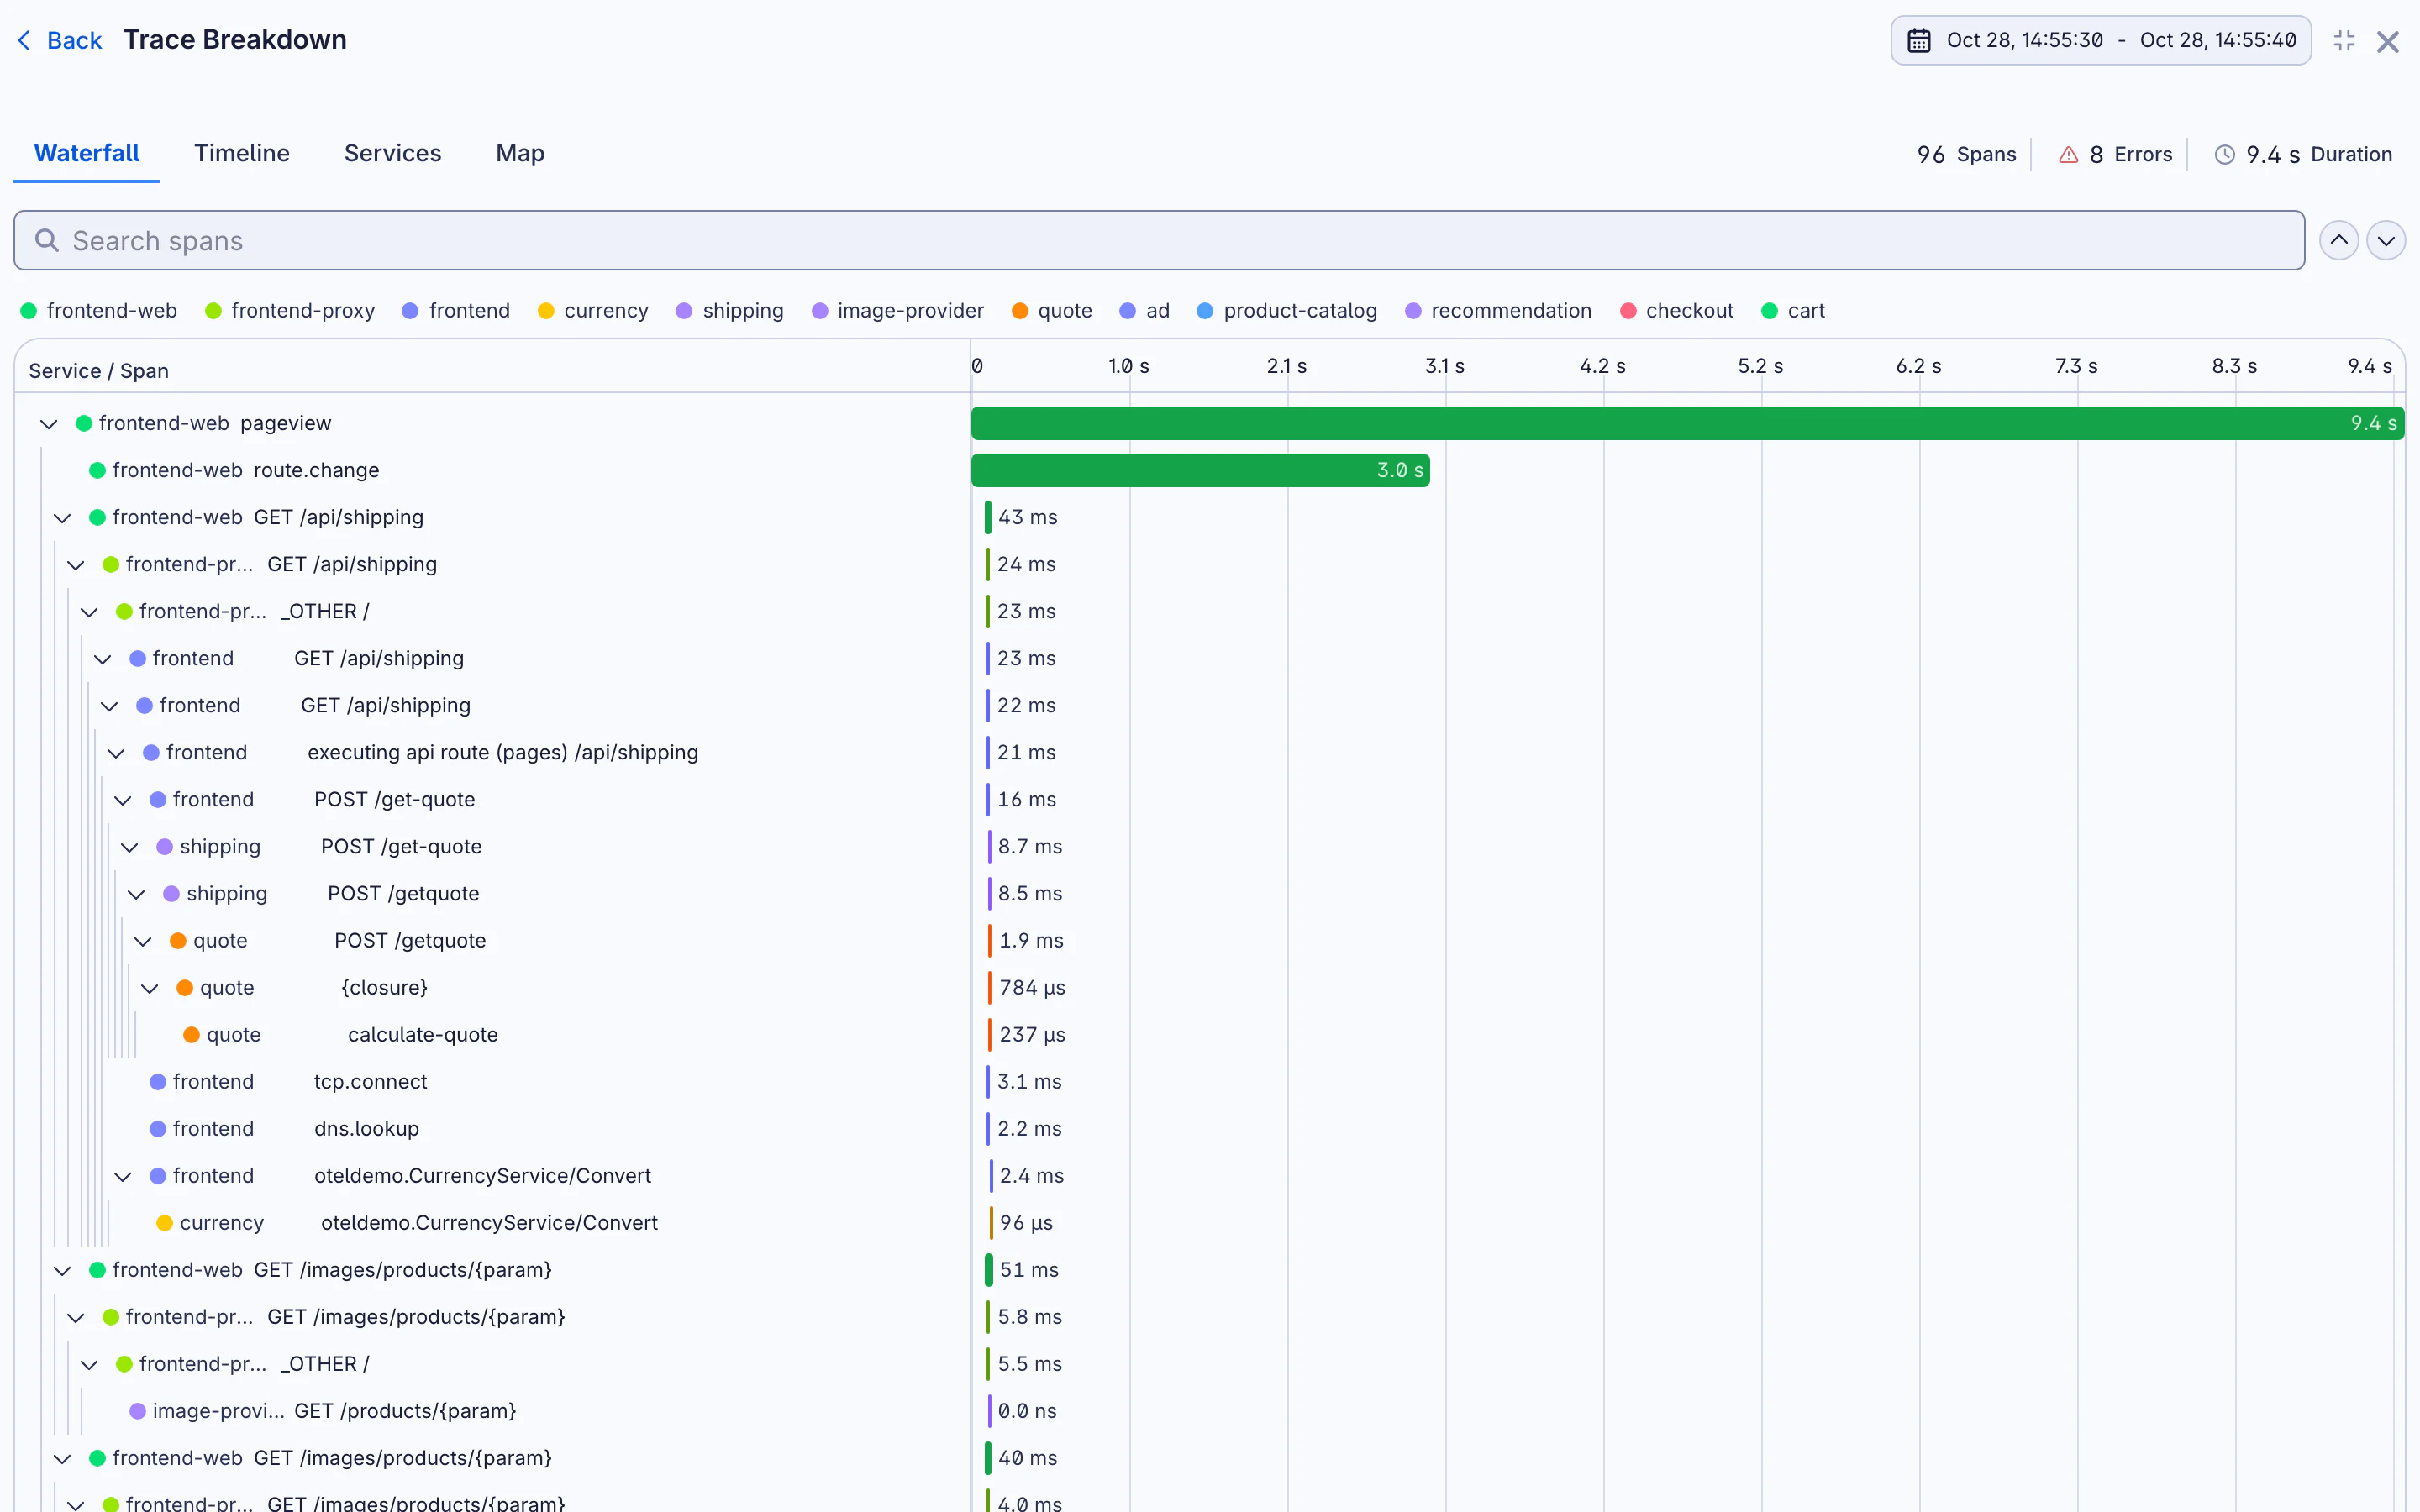
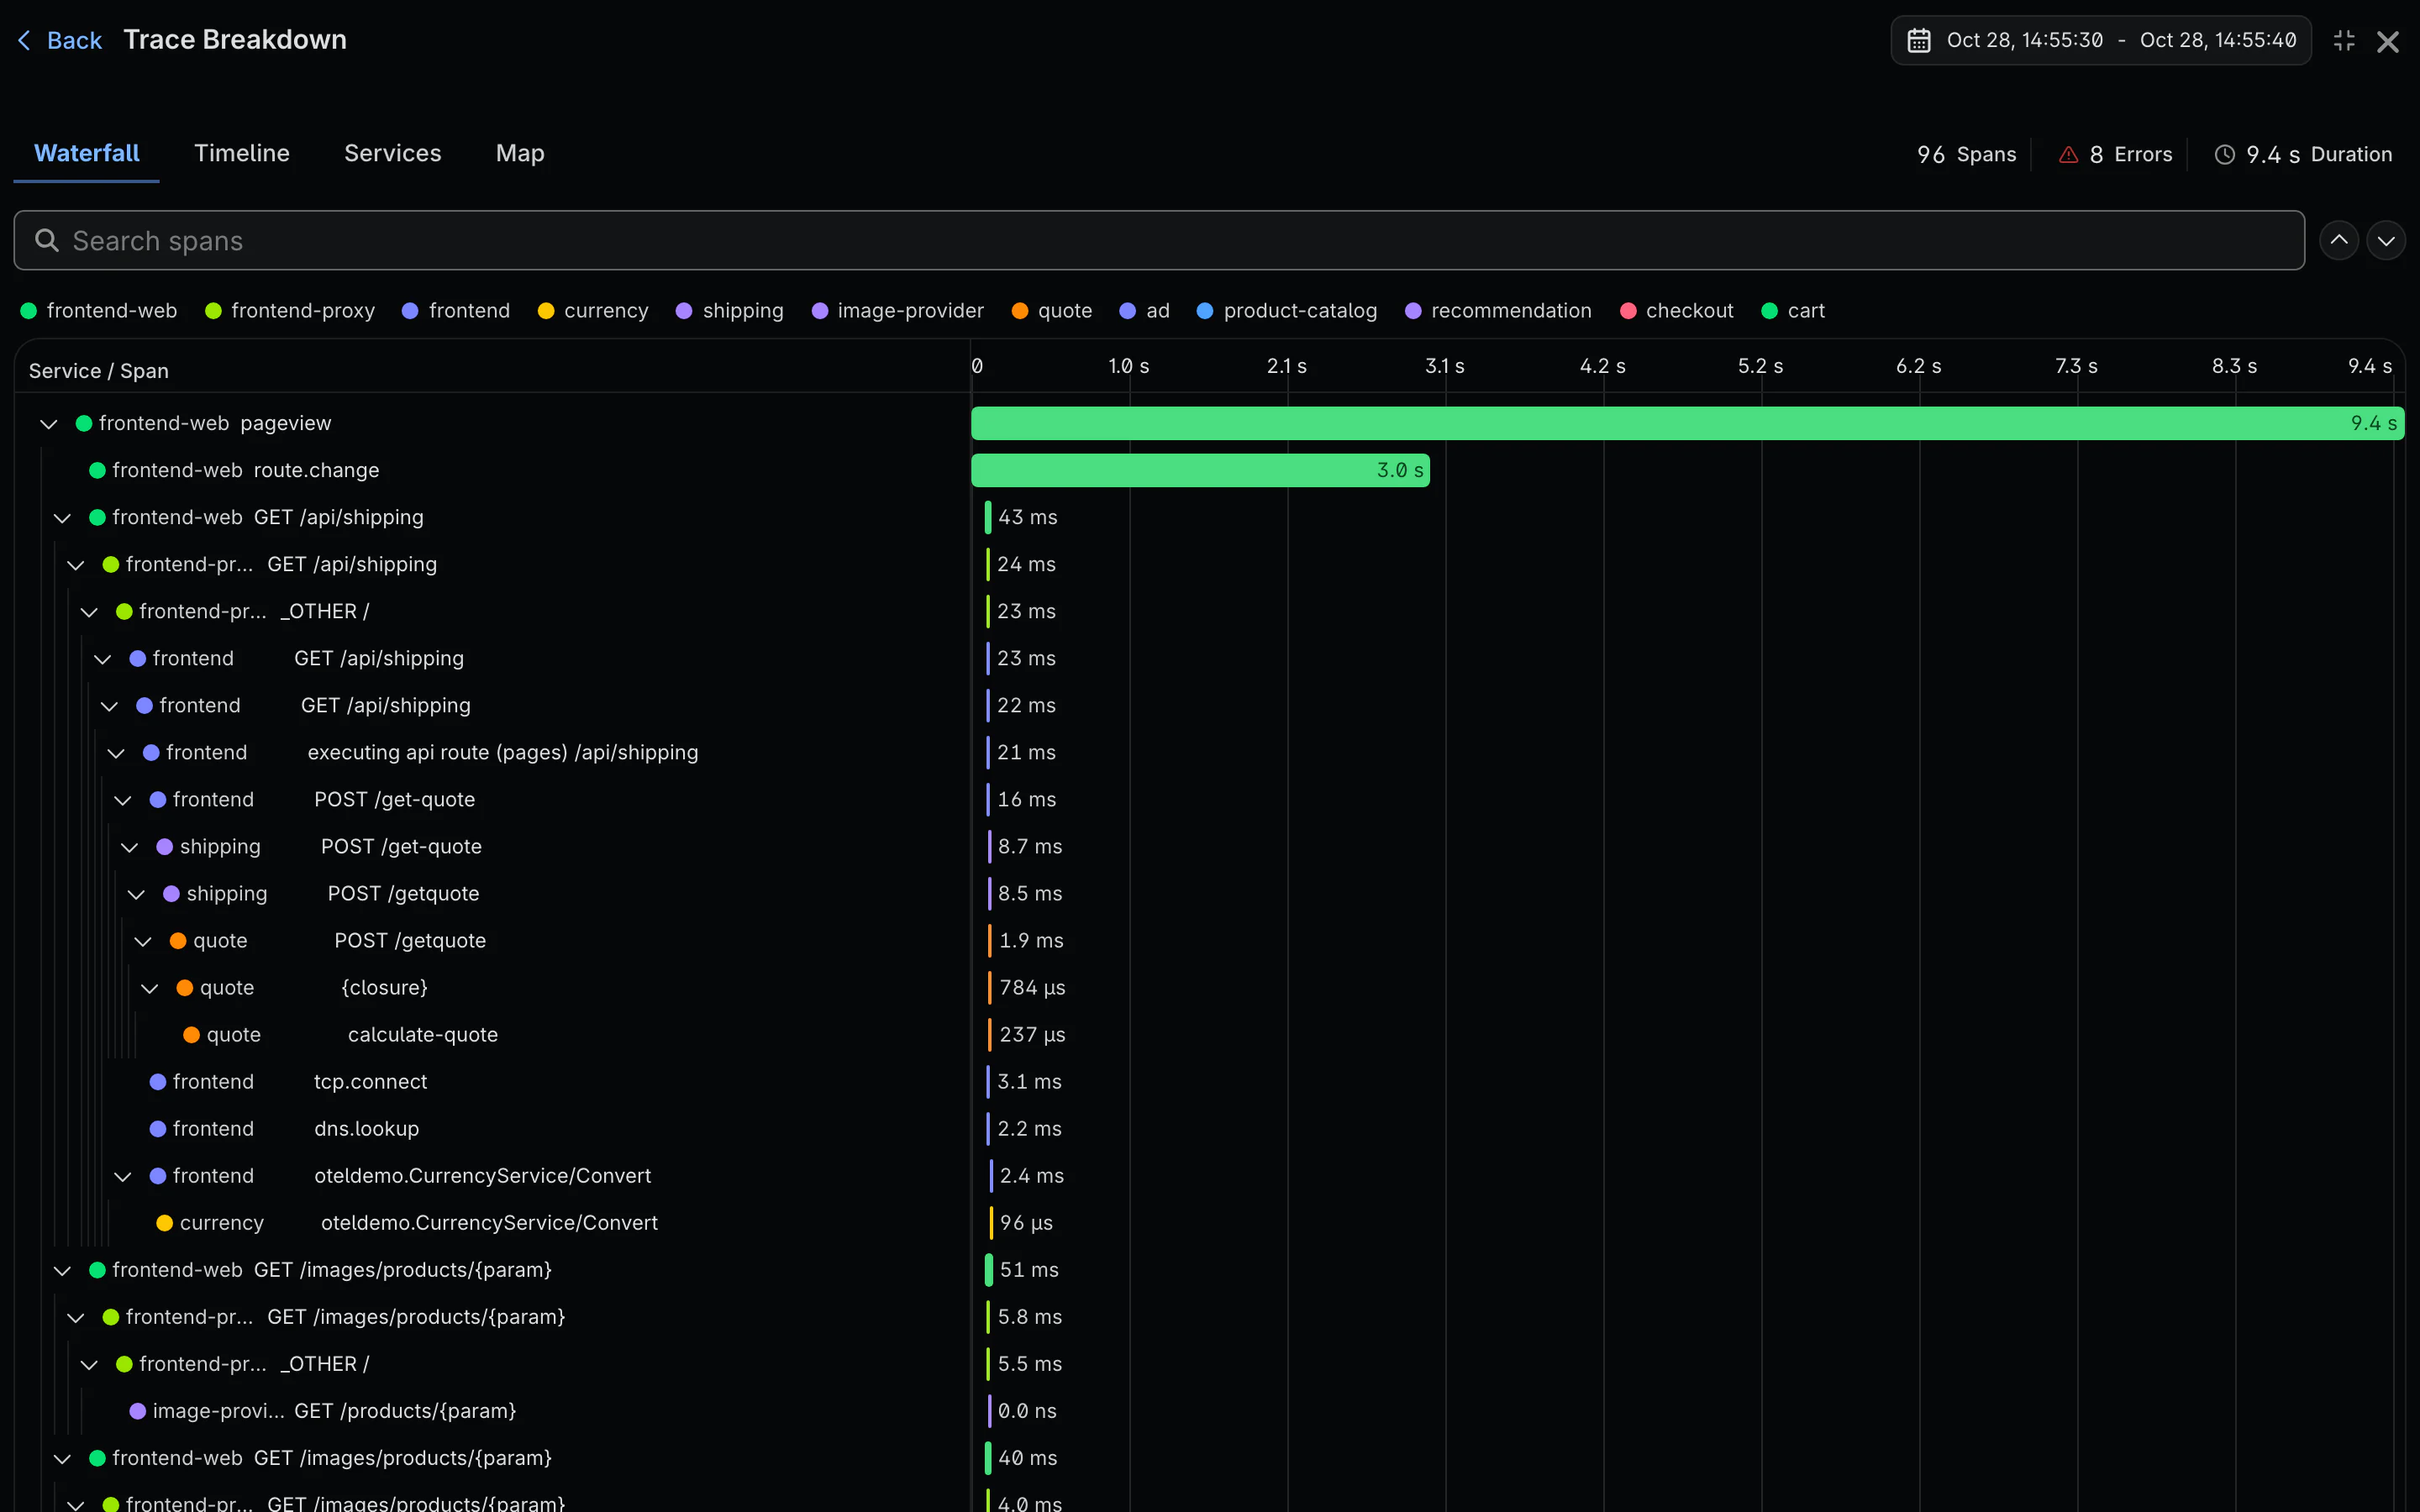
Trace waterfall
Every span of a request across services, with its database queries, outgoing calls and logs in order.
-
Service map
Built from your spans: which service calls which, with request rate, errors and latency on each edge.
-
Dashboards to start from
Templates for the OpenTelemetry Collector, Kubernetes, PostgreSQL, Redis, nginx and more.
03 · Beyond the span
Our SDKs add the request and response bodies
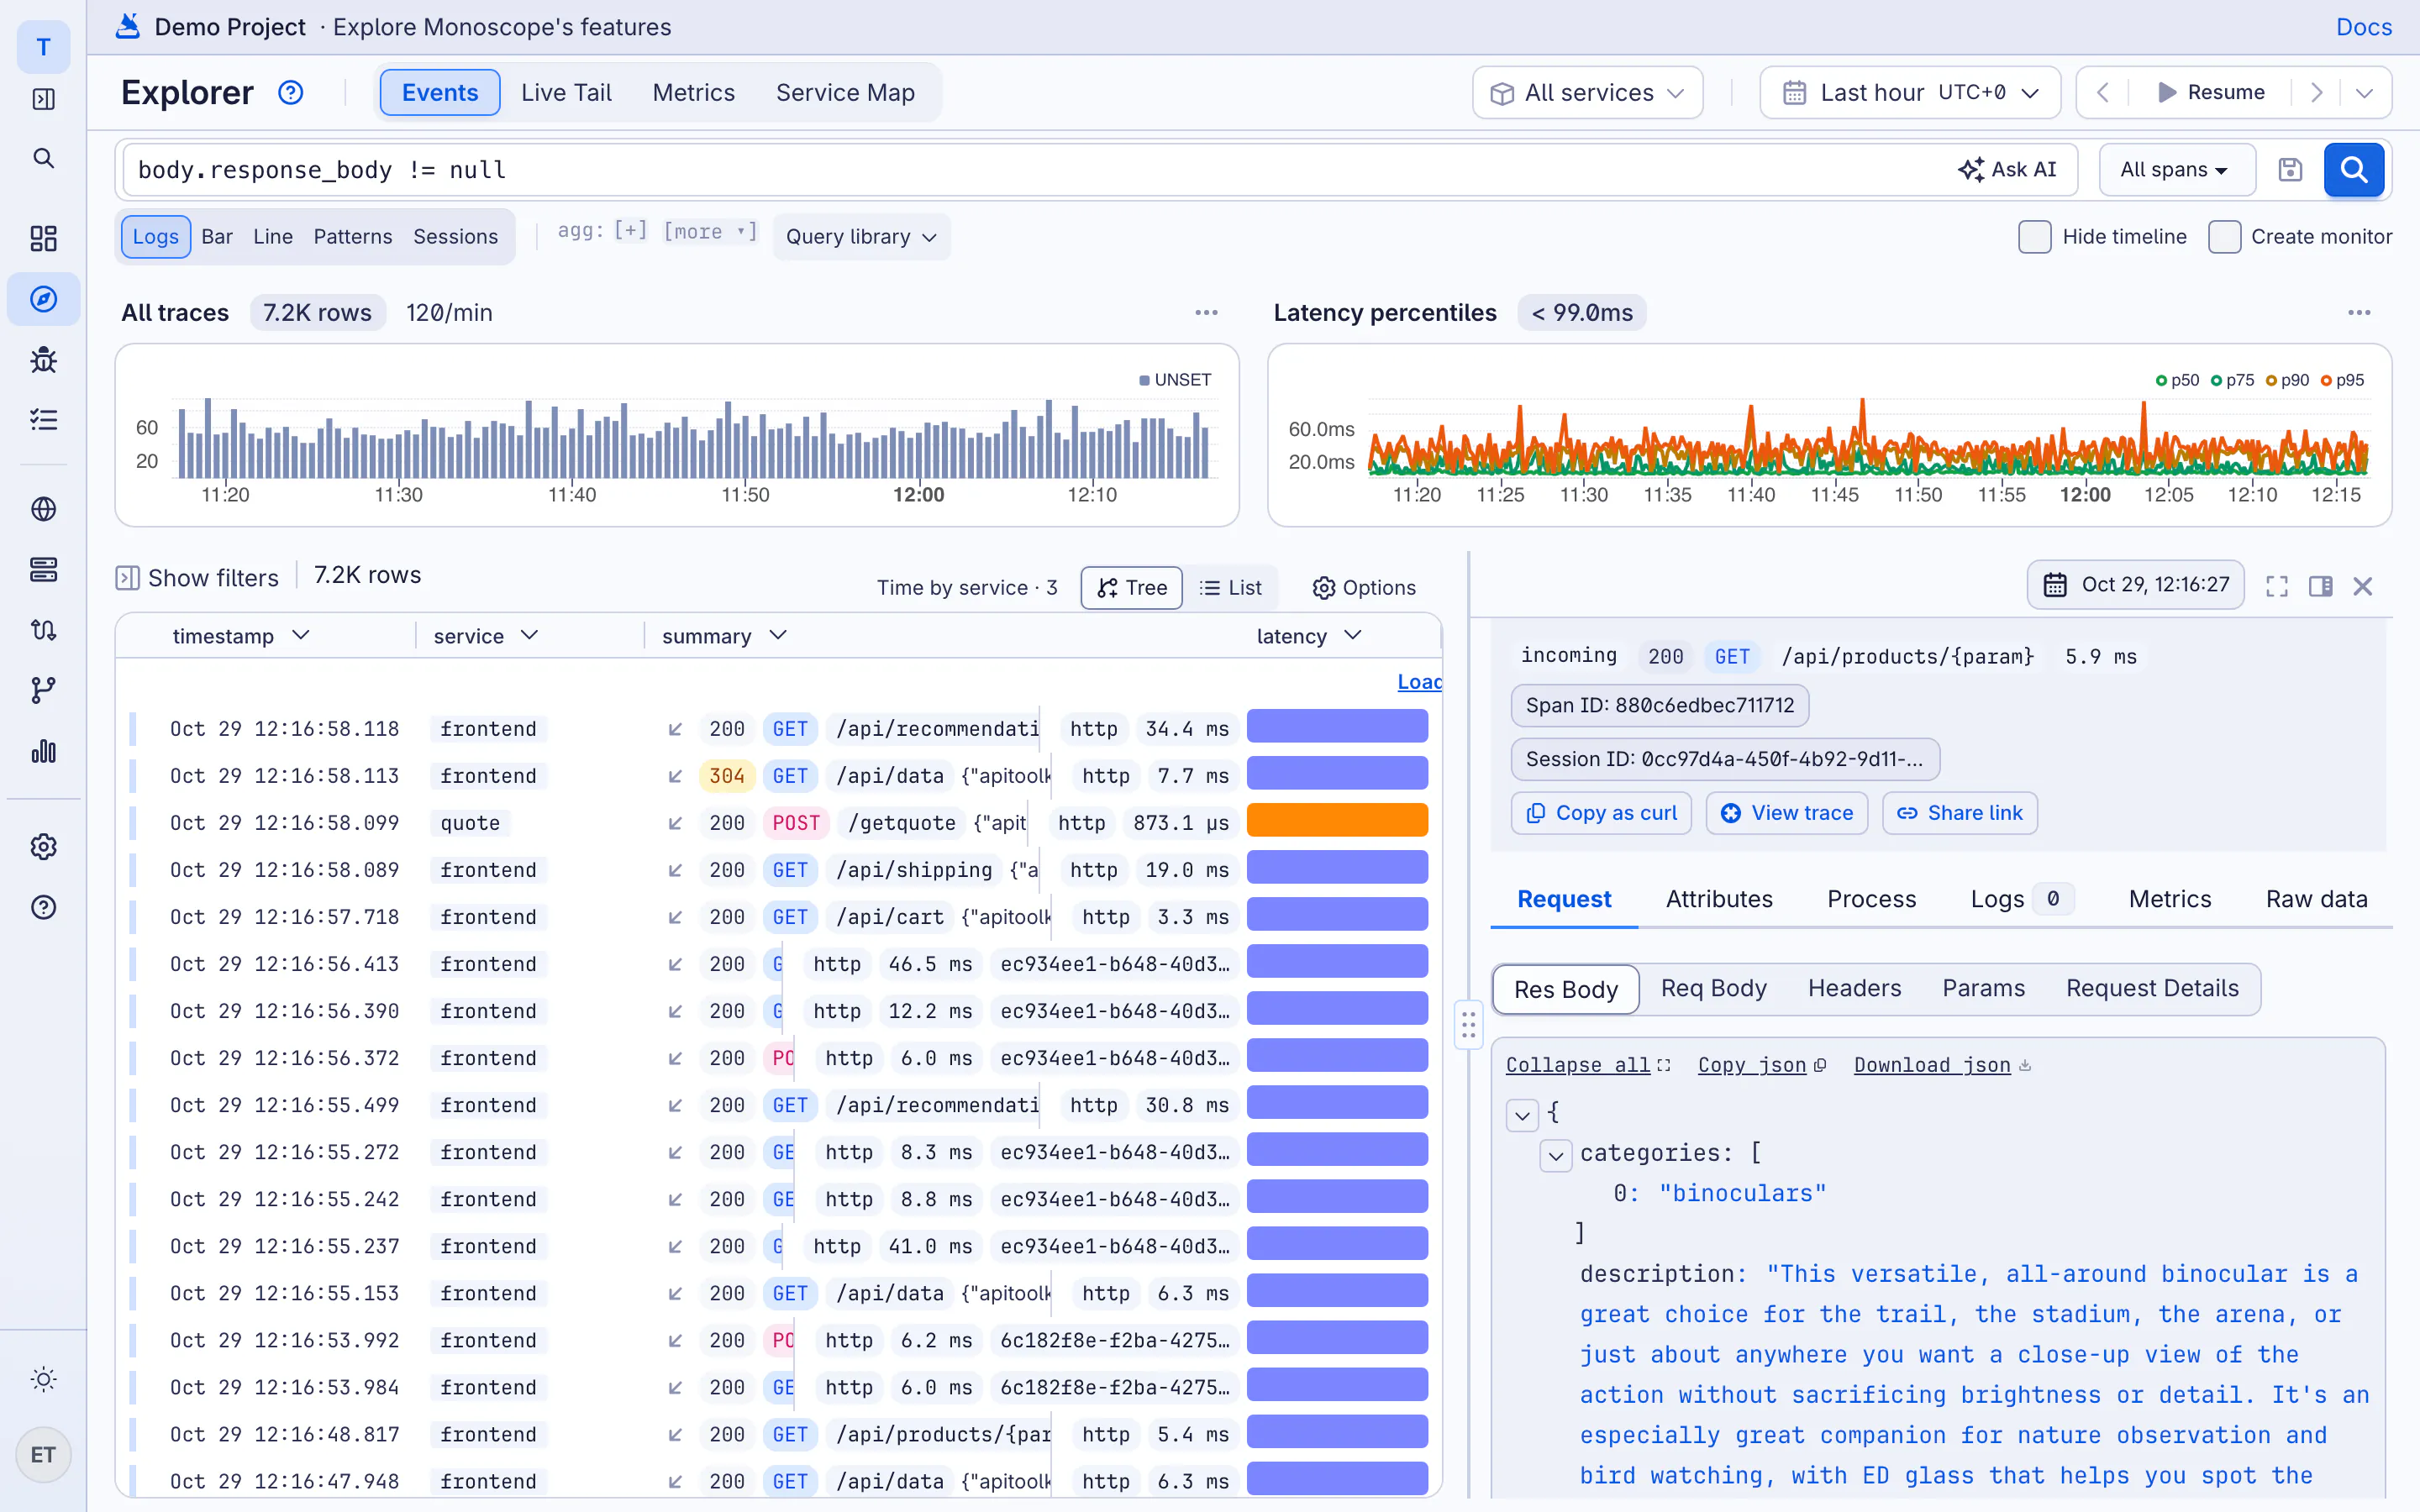
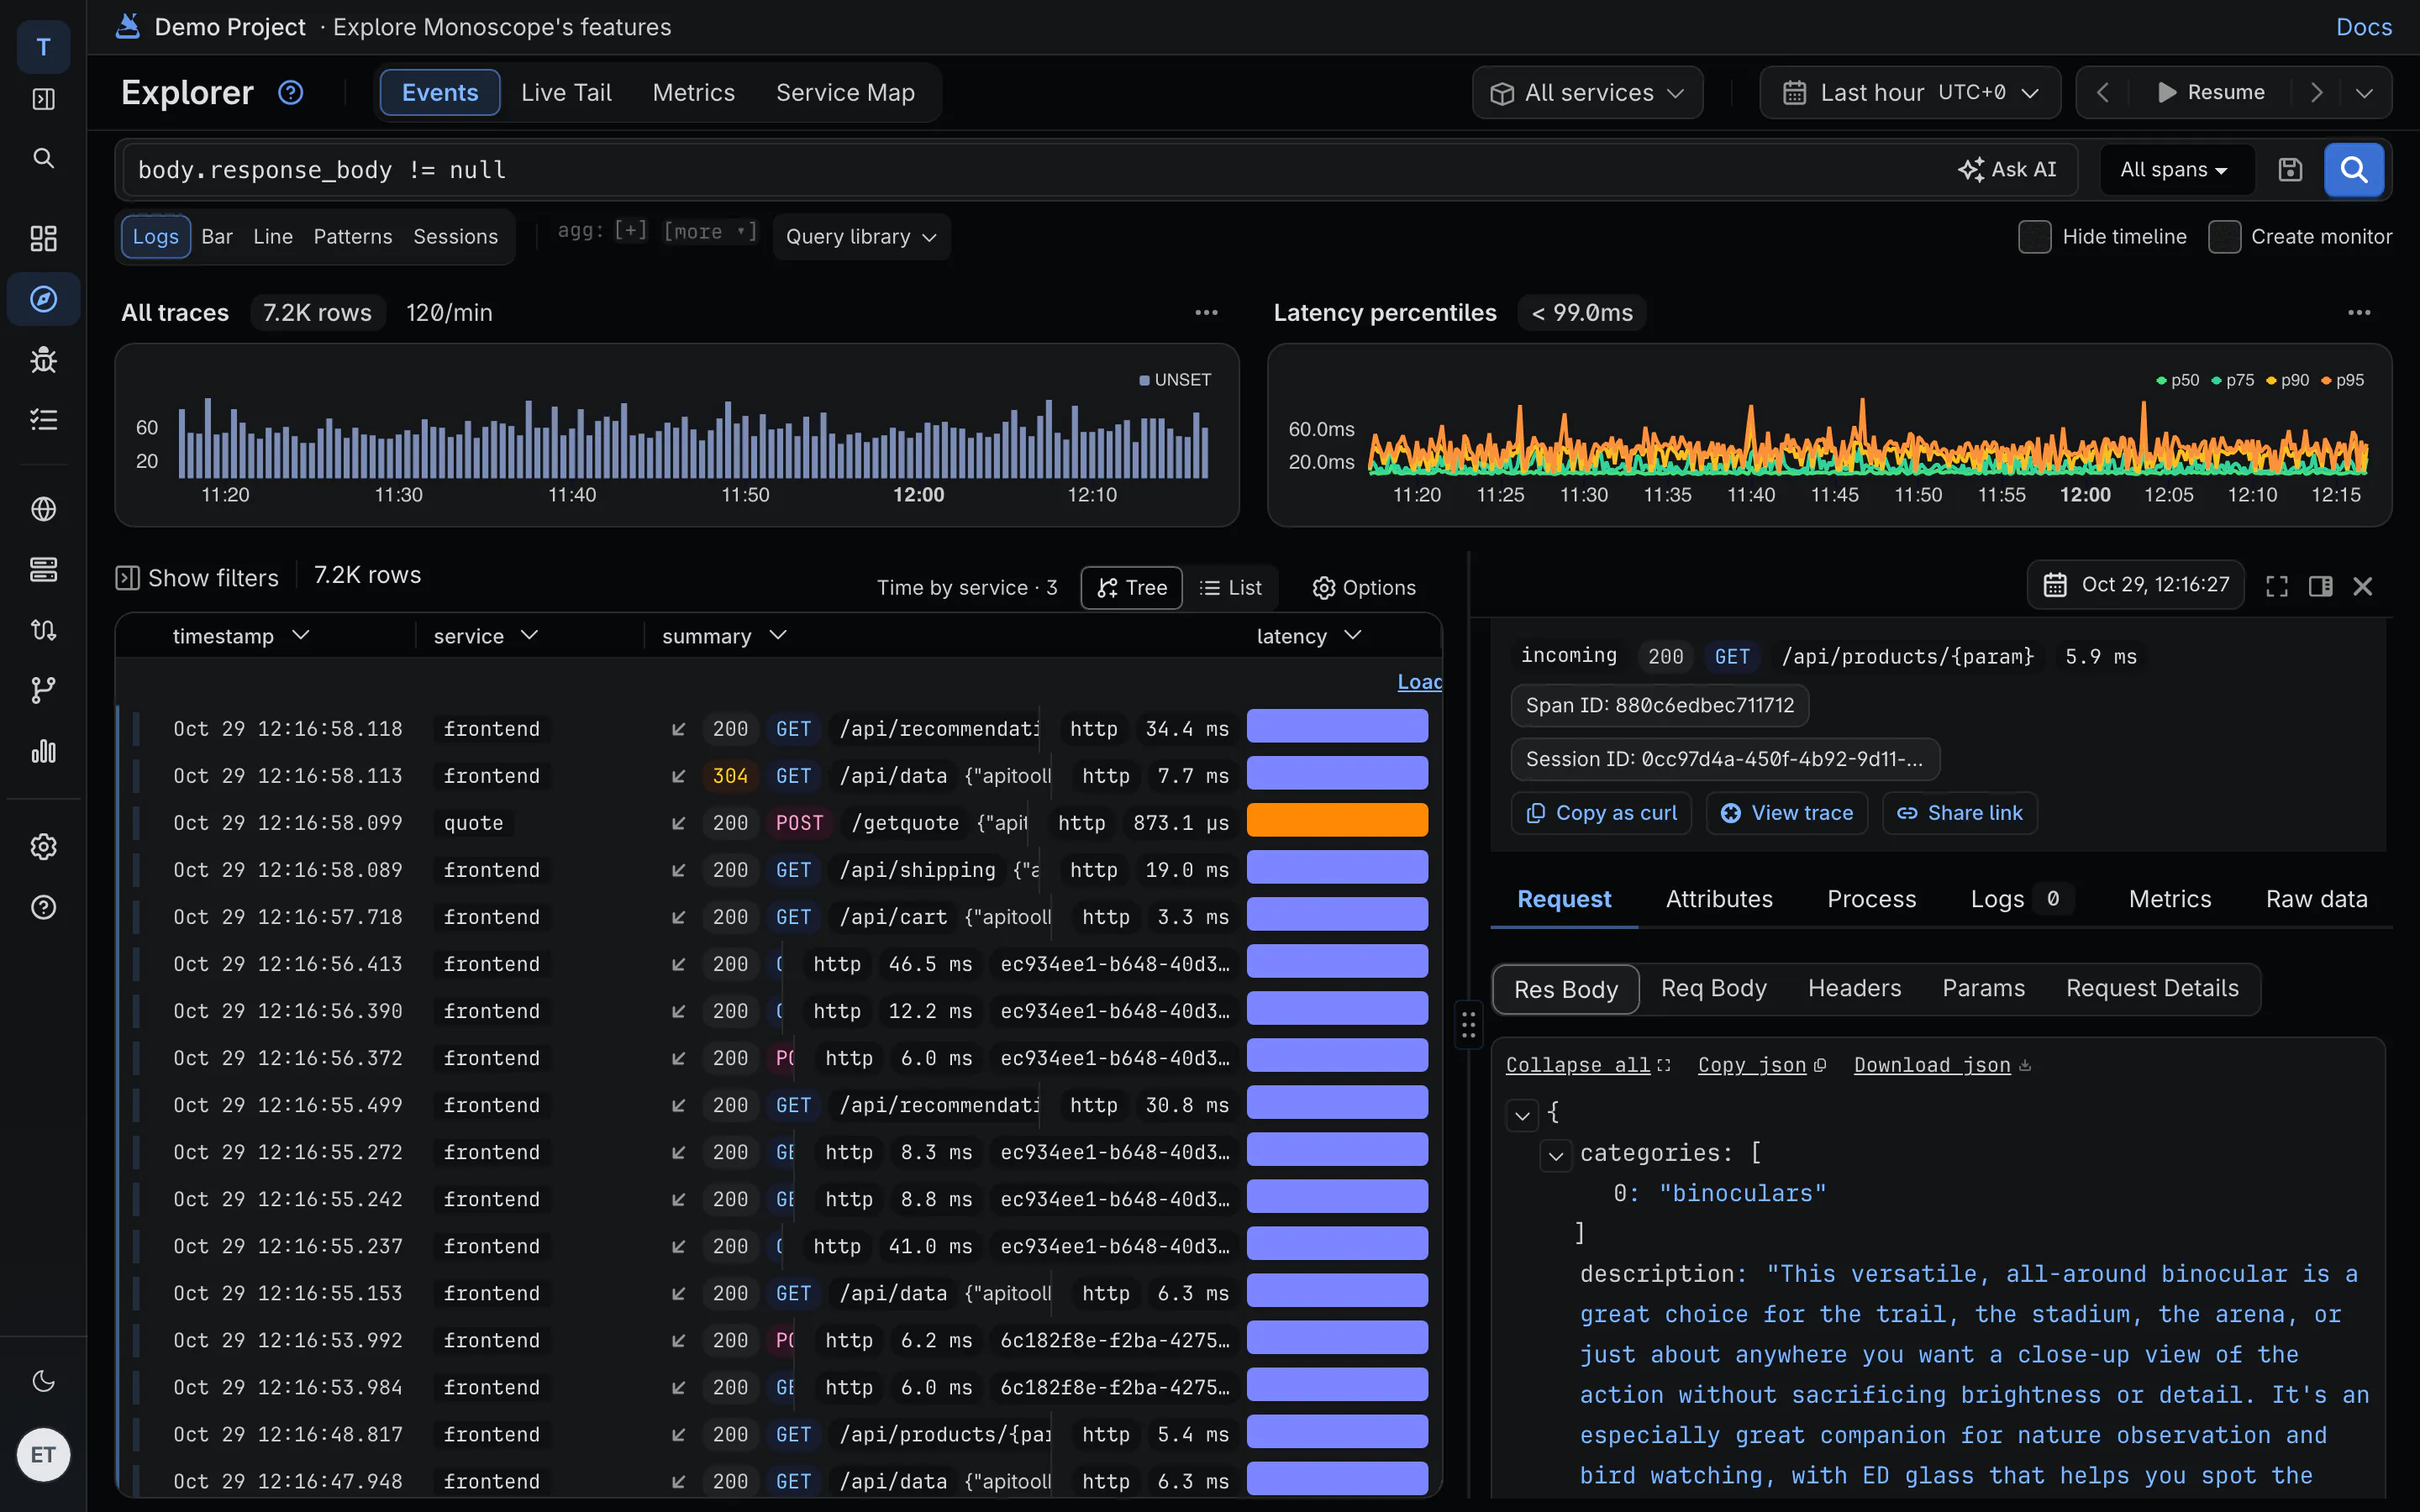
A plain OpenTelemetry span says POST /v1/payments returned 502. Our SDKs for Node.js, Python, Go, PHP, Java, .NET and Elixir sit on top of OpenTelemetry and add the headers, request body and response body, for incoming calls and the calls you make to suppliers.
-
Still OpenTelemetry
The SDKs emit standard OTel spans and attributes, so the rest of your instrumentation keeps working.
-
Redacted in your app
List headers and JSON paths such as $.password, and they're removed before anything is sent.
-
What the AI SRE reads
Investigations start from the failing request and response, not a span name and a status code.
04 · Telemetry quality
Routines that check your instrumentation
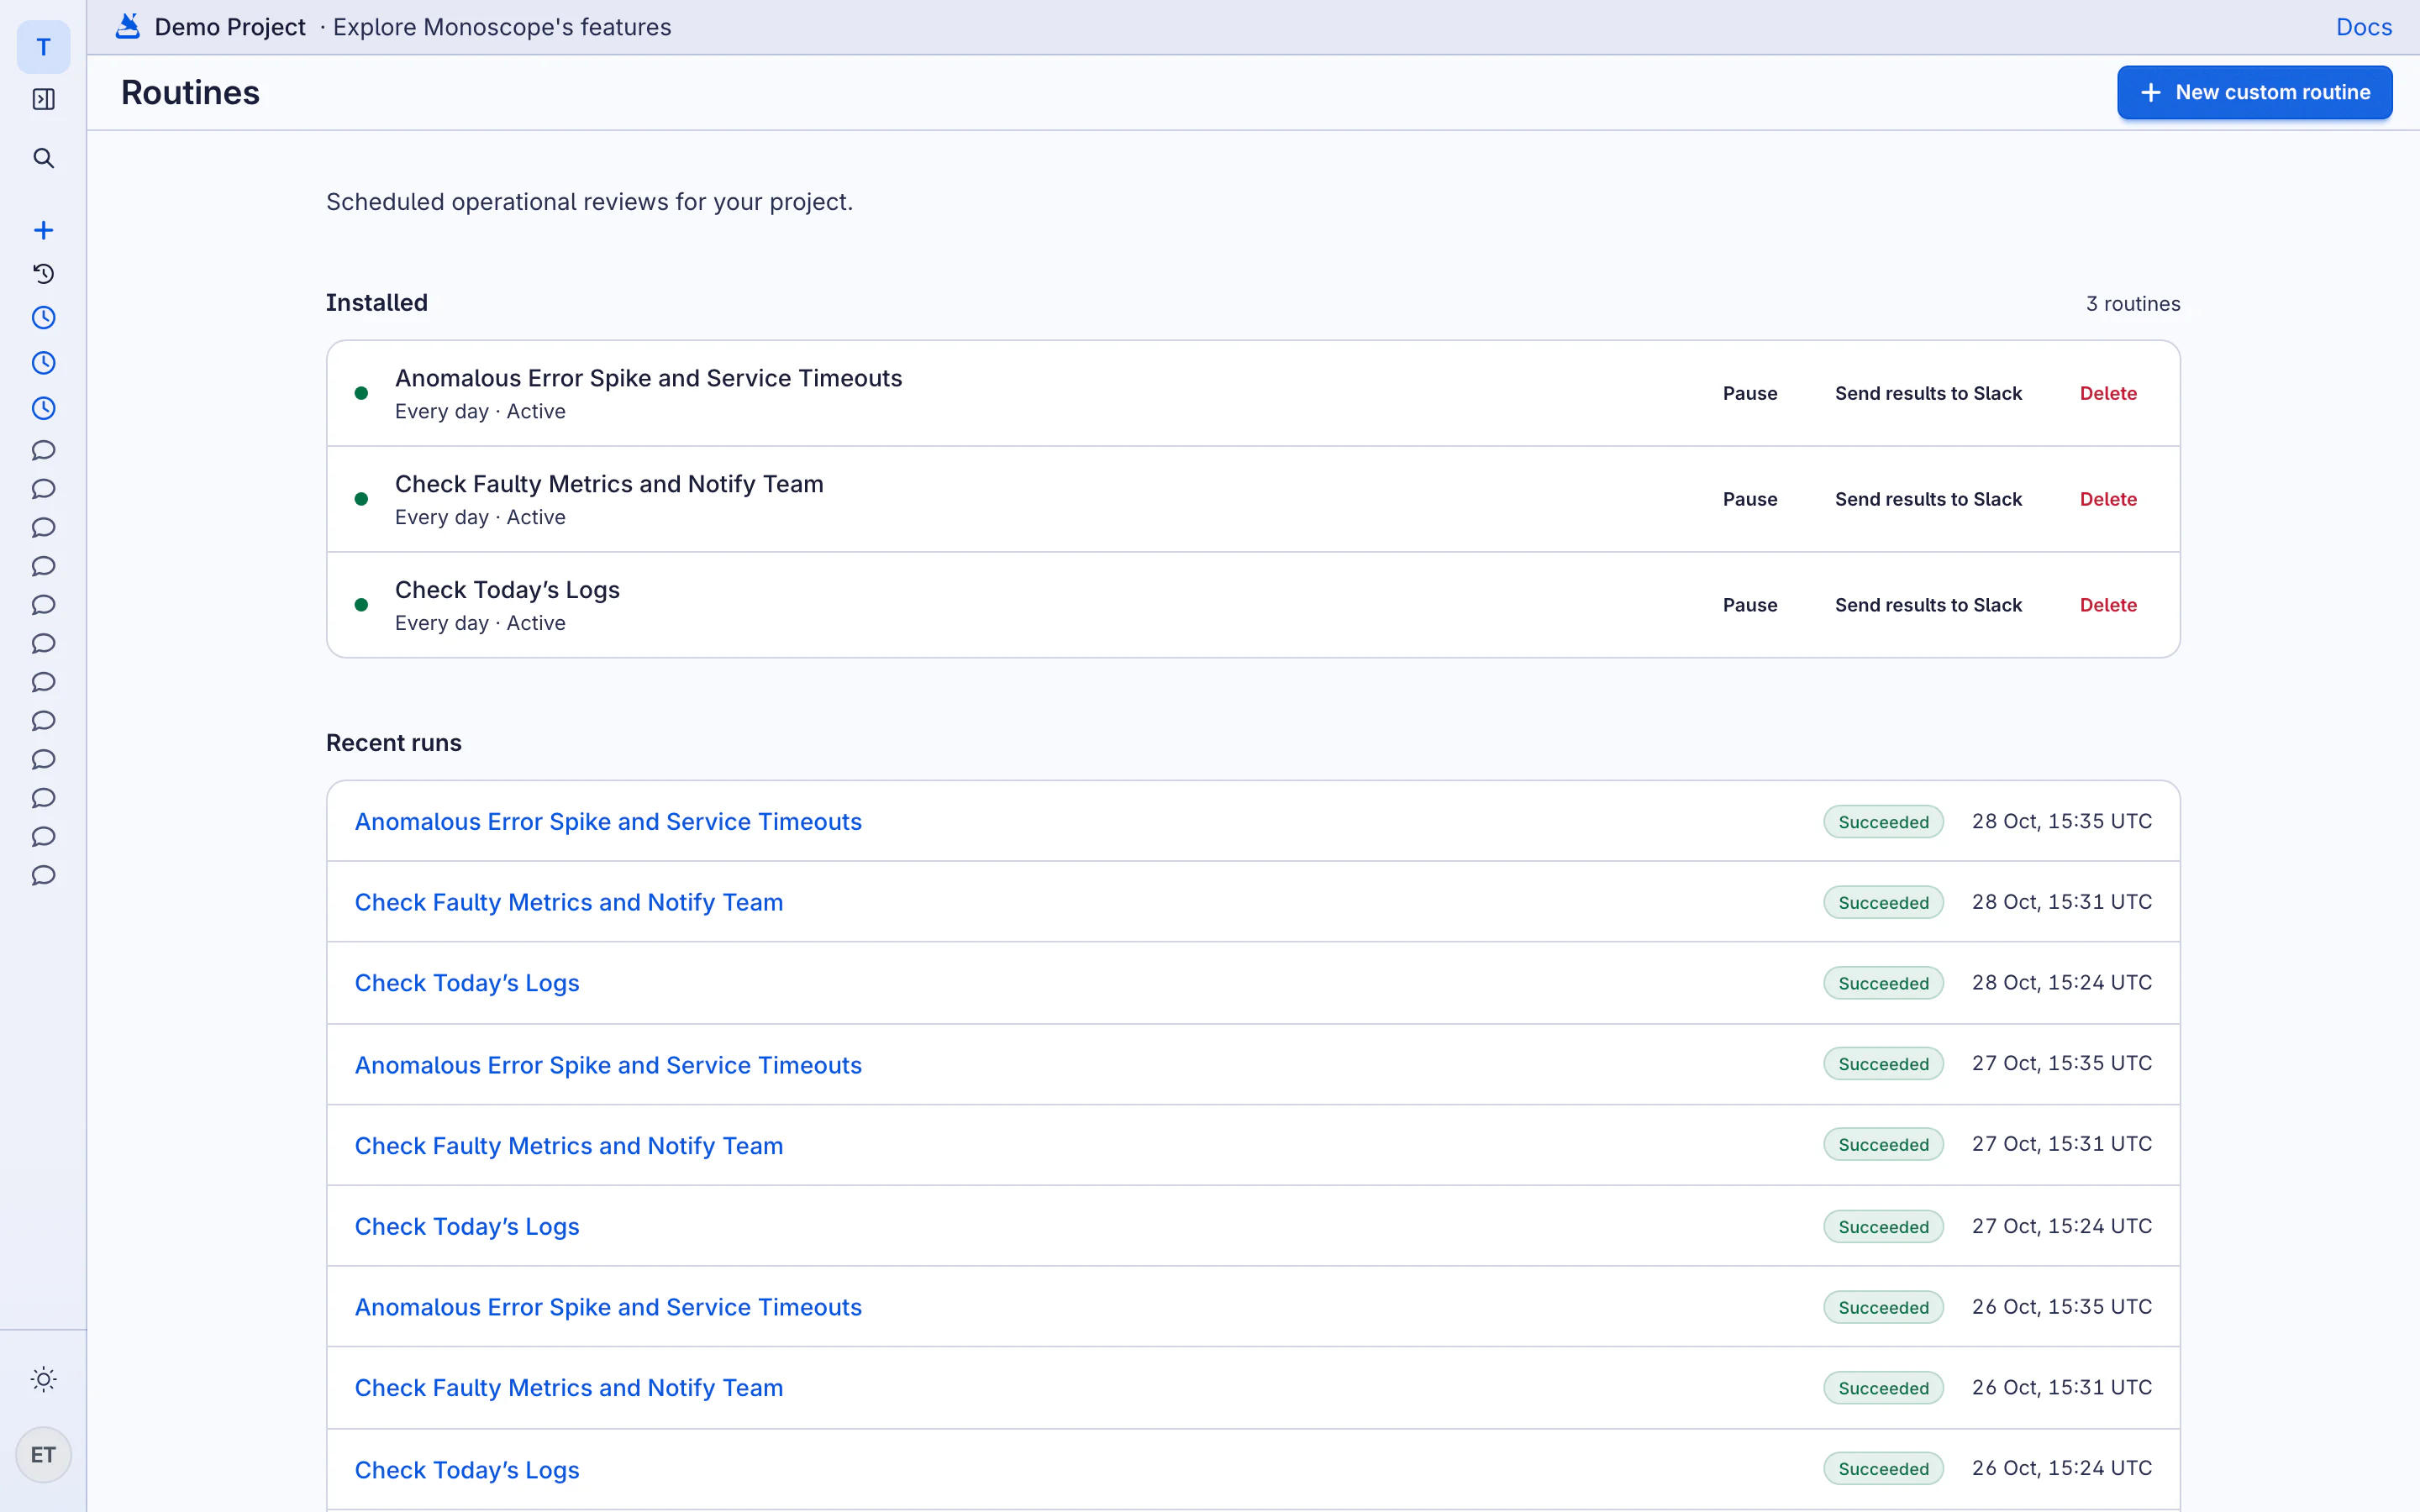
OpenTelemetry setups drift. Routines run on a schedule and post to Slack when something needs fixing.
-
Telemetry gap detector
Flags services that were active and stopped sending logs, traces or metrics.
-
Trace correlation audit
Finds logs and spans that can't be joined because trace context is missing.
-
Telemetry quality check
Lists missing or inconsistent service, environment and version attributes, ranked by impact.
Questions
Do I need the monoscope SDK?
No. Any OpenTelemetry SDK or collector sends logs, traces and metrics. Our SDKs add request and response bodies, with redaction.
Which protocols do you accept?
OTLP over gRPC (port 4317) and over HTTP (port 4318). Send your API key as the x-api-key resource attribute or header.
Can I send to monoscope and my current vendor at once?
Yes. Add monoscope as a second exporter in your collector and compare the two for a week or two before you switch.
How is it priced?
Per event, not per host. Free for 10k events a day; Cloud is $29 a month for 20M events, then $1 per million. Metrics: 20M datapoints included, then $1 per 10M.
Can I self-host it?
Yes. monoscope is open source under AGPL. Run it on your own servers and point your collectors at it.