Integrations
-
Prometheus scraping. Add
/metricsendpoints as scrape targets in a new Prometheus settings page. Each target has its own interval, auth header and labels, a health badge, a Test connection button, and a link to its metrics. Private network addresses are blocked. -
OTLP over HTTP. Send traces and logs to
/v1/tracesand/v1/logswith anx-api-keyheader. No collector needed.
CLI, MCP & Agents
-
Monitors as code. Export monitors to YAML and apply them back.
monitors applymatches on the alert title, so running it twice changes nothing. -
Output.
--json,--yamland--table, chosen for you when omitted: a terminal gets a table, a pipe gets JSON. -
Search. Plain words search full text,
--servicerepeats,--limitworks everywhere, long--sincewindows come back as one result, andevents get --fieldprints the fields you name. -
Bad KQL returns an error with a suggested fix, and
metrics query --assertworks again for CI checks.
Logs & Traces
- Paging and live tail. No duplicate rows across pages, Show earlier events loads from the oldest row on screen, live tail no longer stalls, and hidden or reordered columns stay that way.
- Error logs in traces. An error log turns its parent span’s badge red in the waterfall.
- Timestamps show in your local time zone, and opening a single log is faster.
Dashboards & Metrics
- Correct Golden Signals. Traffic is a real requests-per-minute rate, p95 latency and totals cover the whole window, and error rates are red.
- Widget errors. A broken widget query shows the reason, such as Column not found or Query timed out, instead of No data.
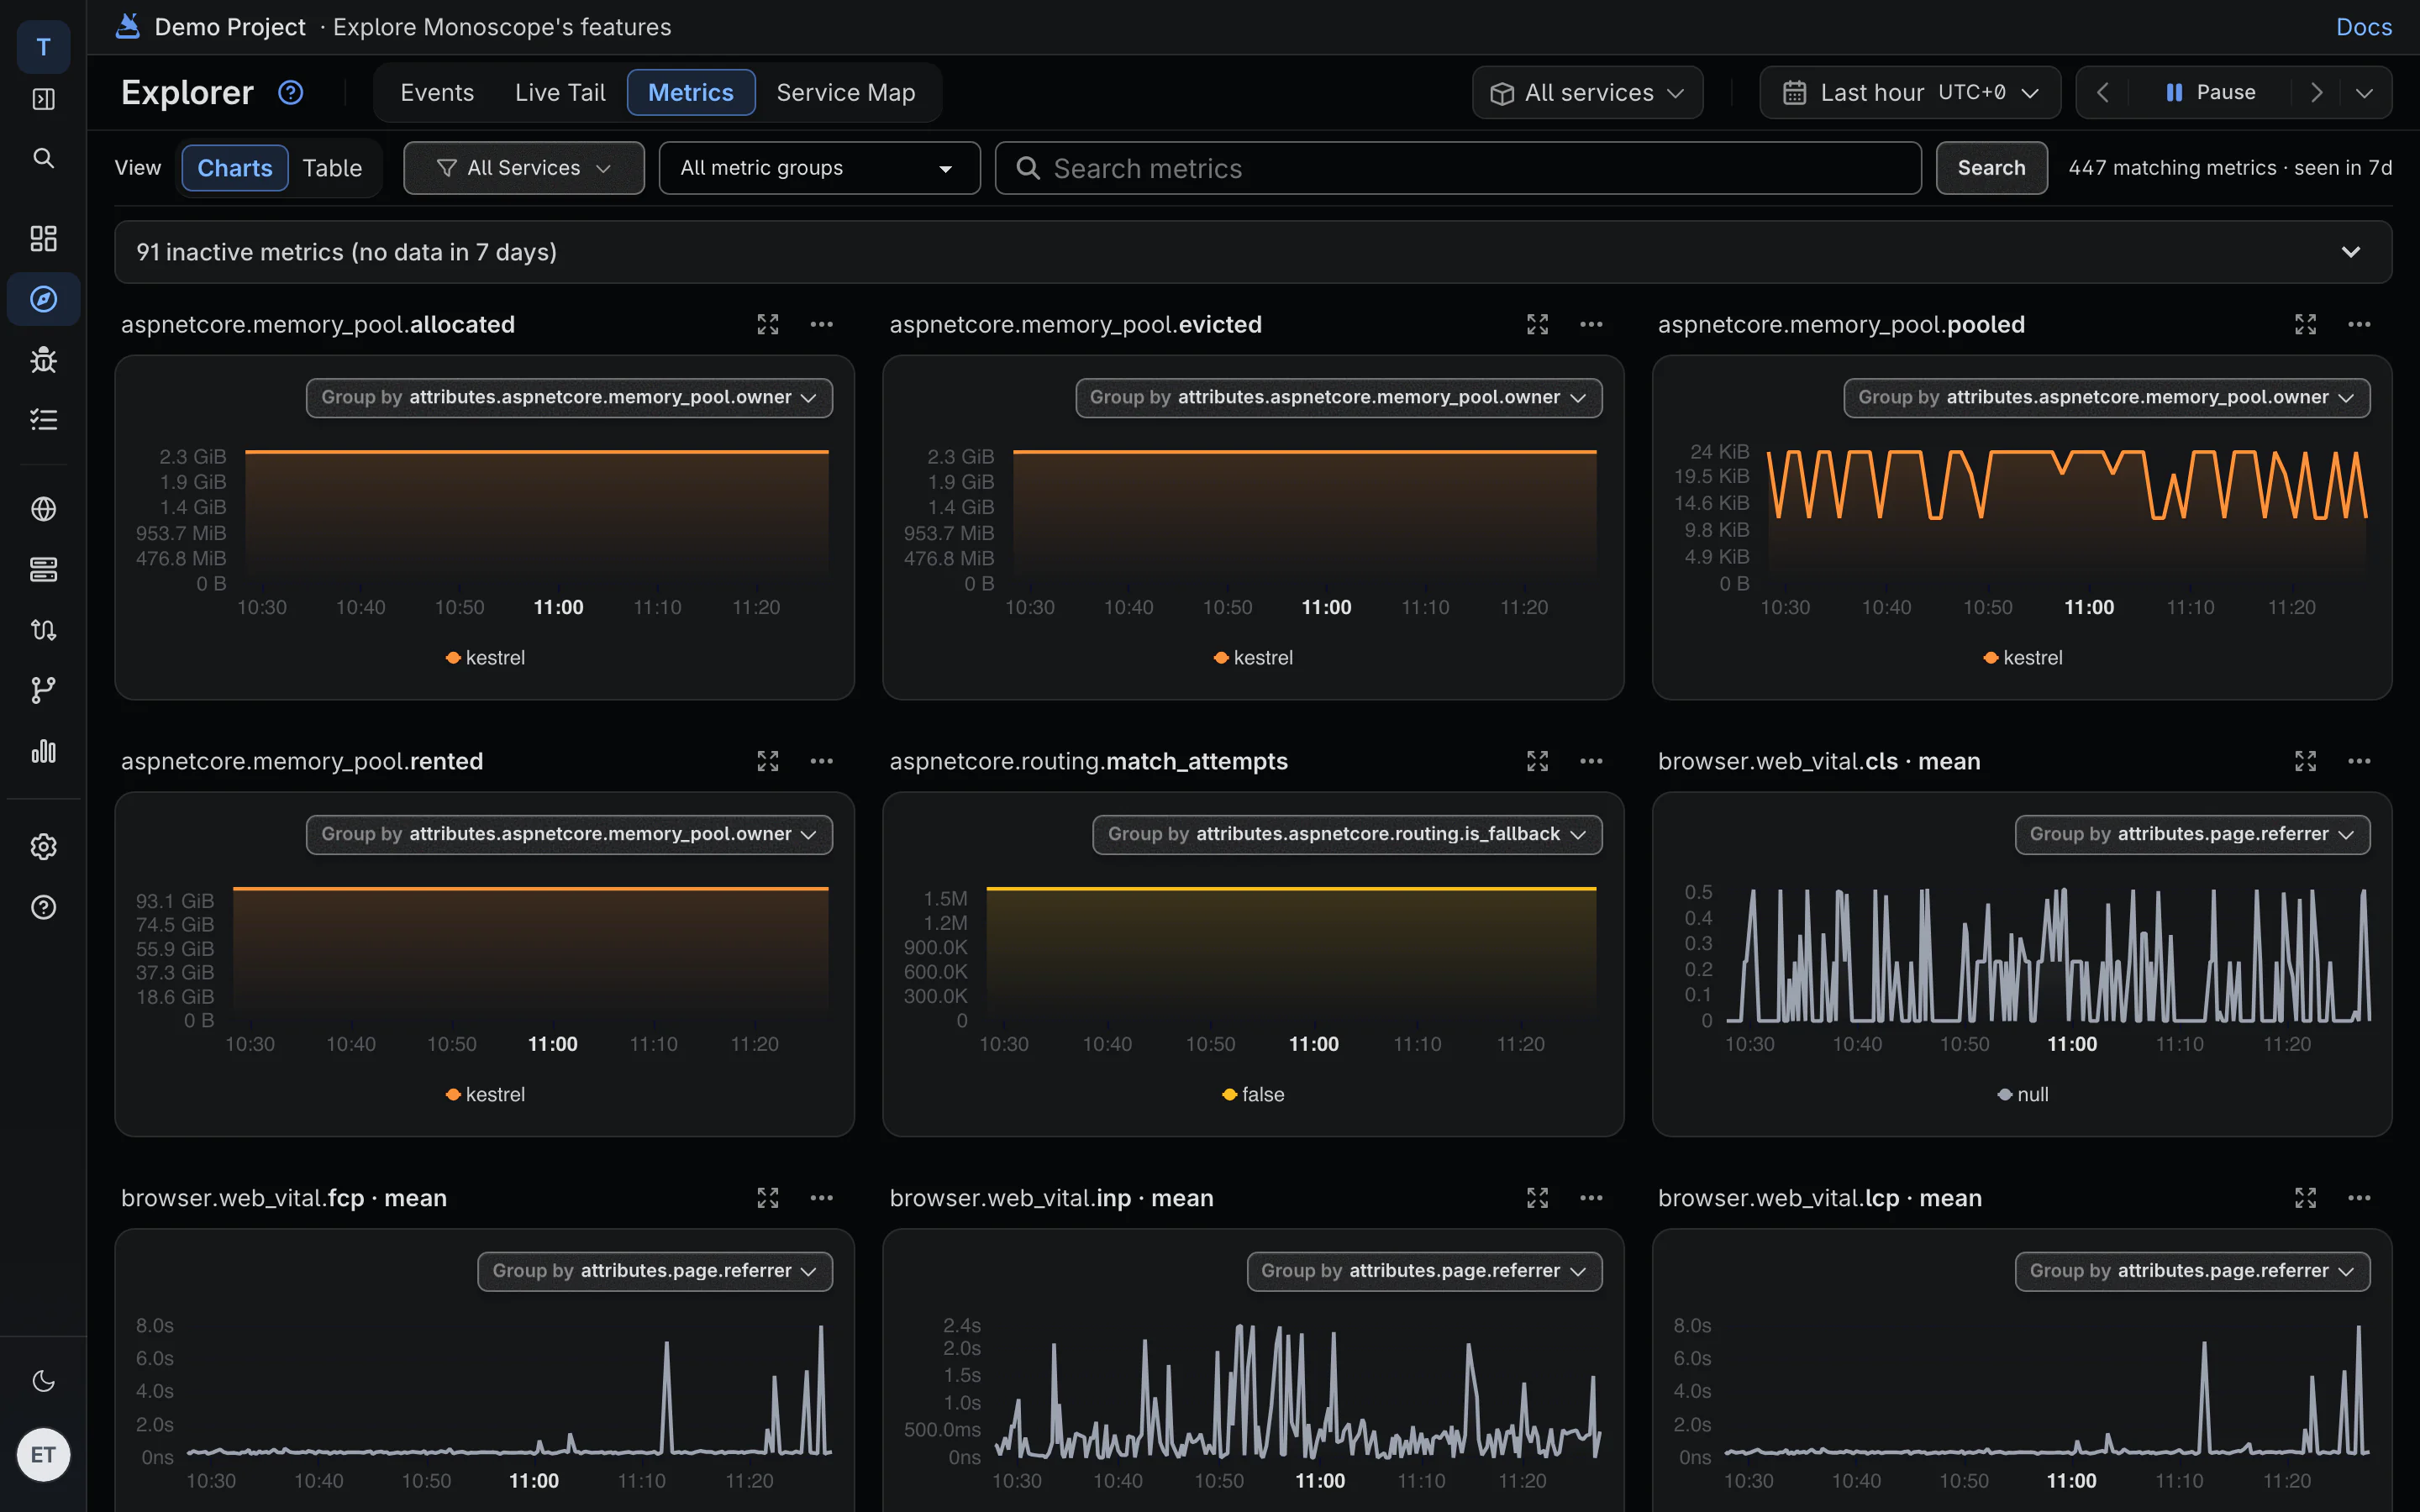
- Metrics charts that filter by service or attribute return data, and a failed fetch no longer leaves a lasting gap in a chart.
Onboarding & Billing
- The install command in onboarding uses https.
Self-Hosting
-
Ingest-only replicas.
CONSUMER_ONLY=Trueruns a replica with no web server or OTLP ports. -
Clean shutdown. Ctrl-C or SIGTERM stops the server within a bounded time, so
docker stopand Kubernetes drains are graceful. - Resilient ingestion. A dead-letter queue with replay, retries on brief database resets, and support for 64 MiB Kafka messages.