CLI, MCP & Agents
-
MCP server. Connect a coding agent to monoscope’s MCP endpoint with an API key. Every API operation is a tool (
search_events,list_monitors,get_schemaand more), plus three workflow tools: find error patterns, search in plain English, and analyze an issue. -
Test data from the CLI.
monoscope send-eventsends a real OpenTelemetry span from a script or CI job.monoscope telemetrygengenerates test traces, logs or metrics, so you don’t need a separate tool. -
Precise search. Events search returns only the matching spans. Add
--with-childrento include each match’s descendants. - Built for agents. Output switches to JSON in CI and agent mode, results share one shape, KQL is checked locally with precise errors, and long queries no longer time out at 30 seconds.
- The public demo project can be queried from the API and CLI without an API key.
Issues
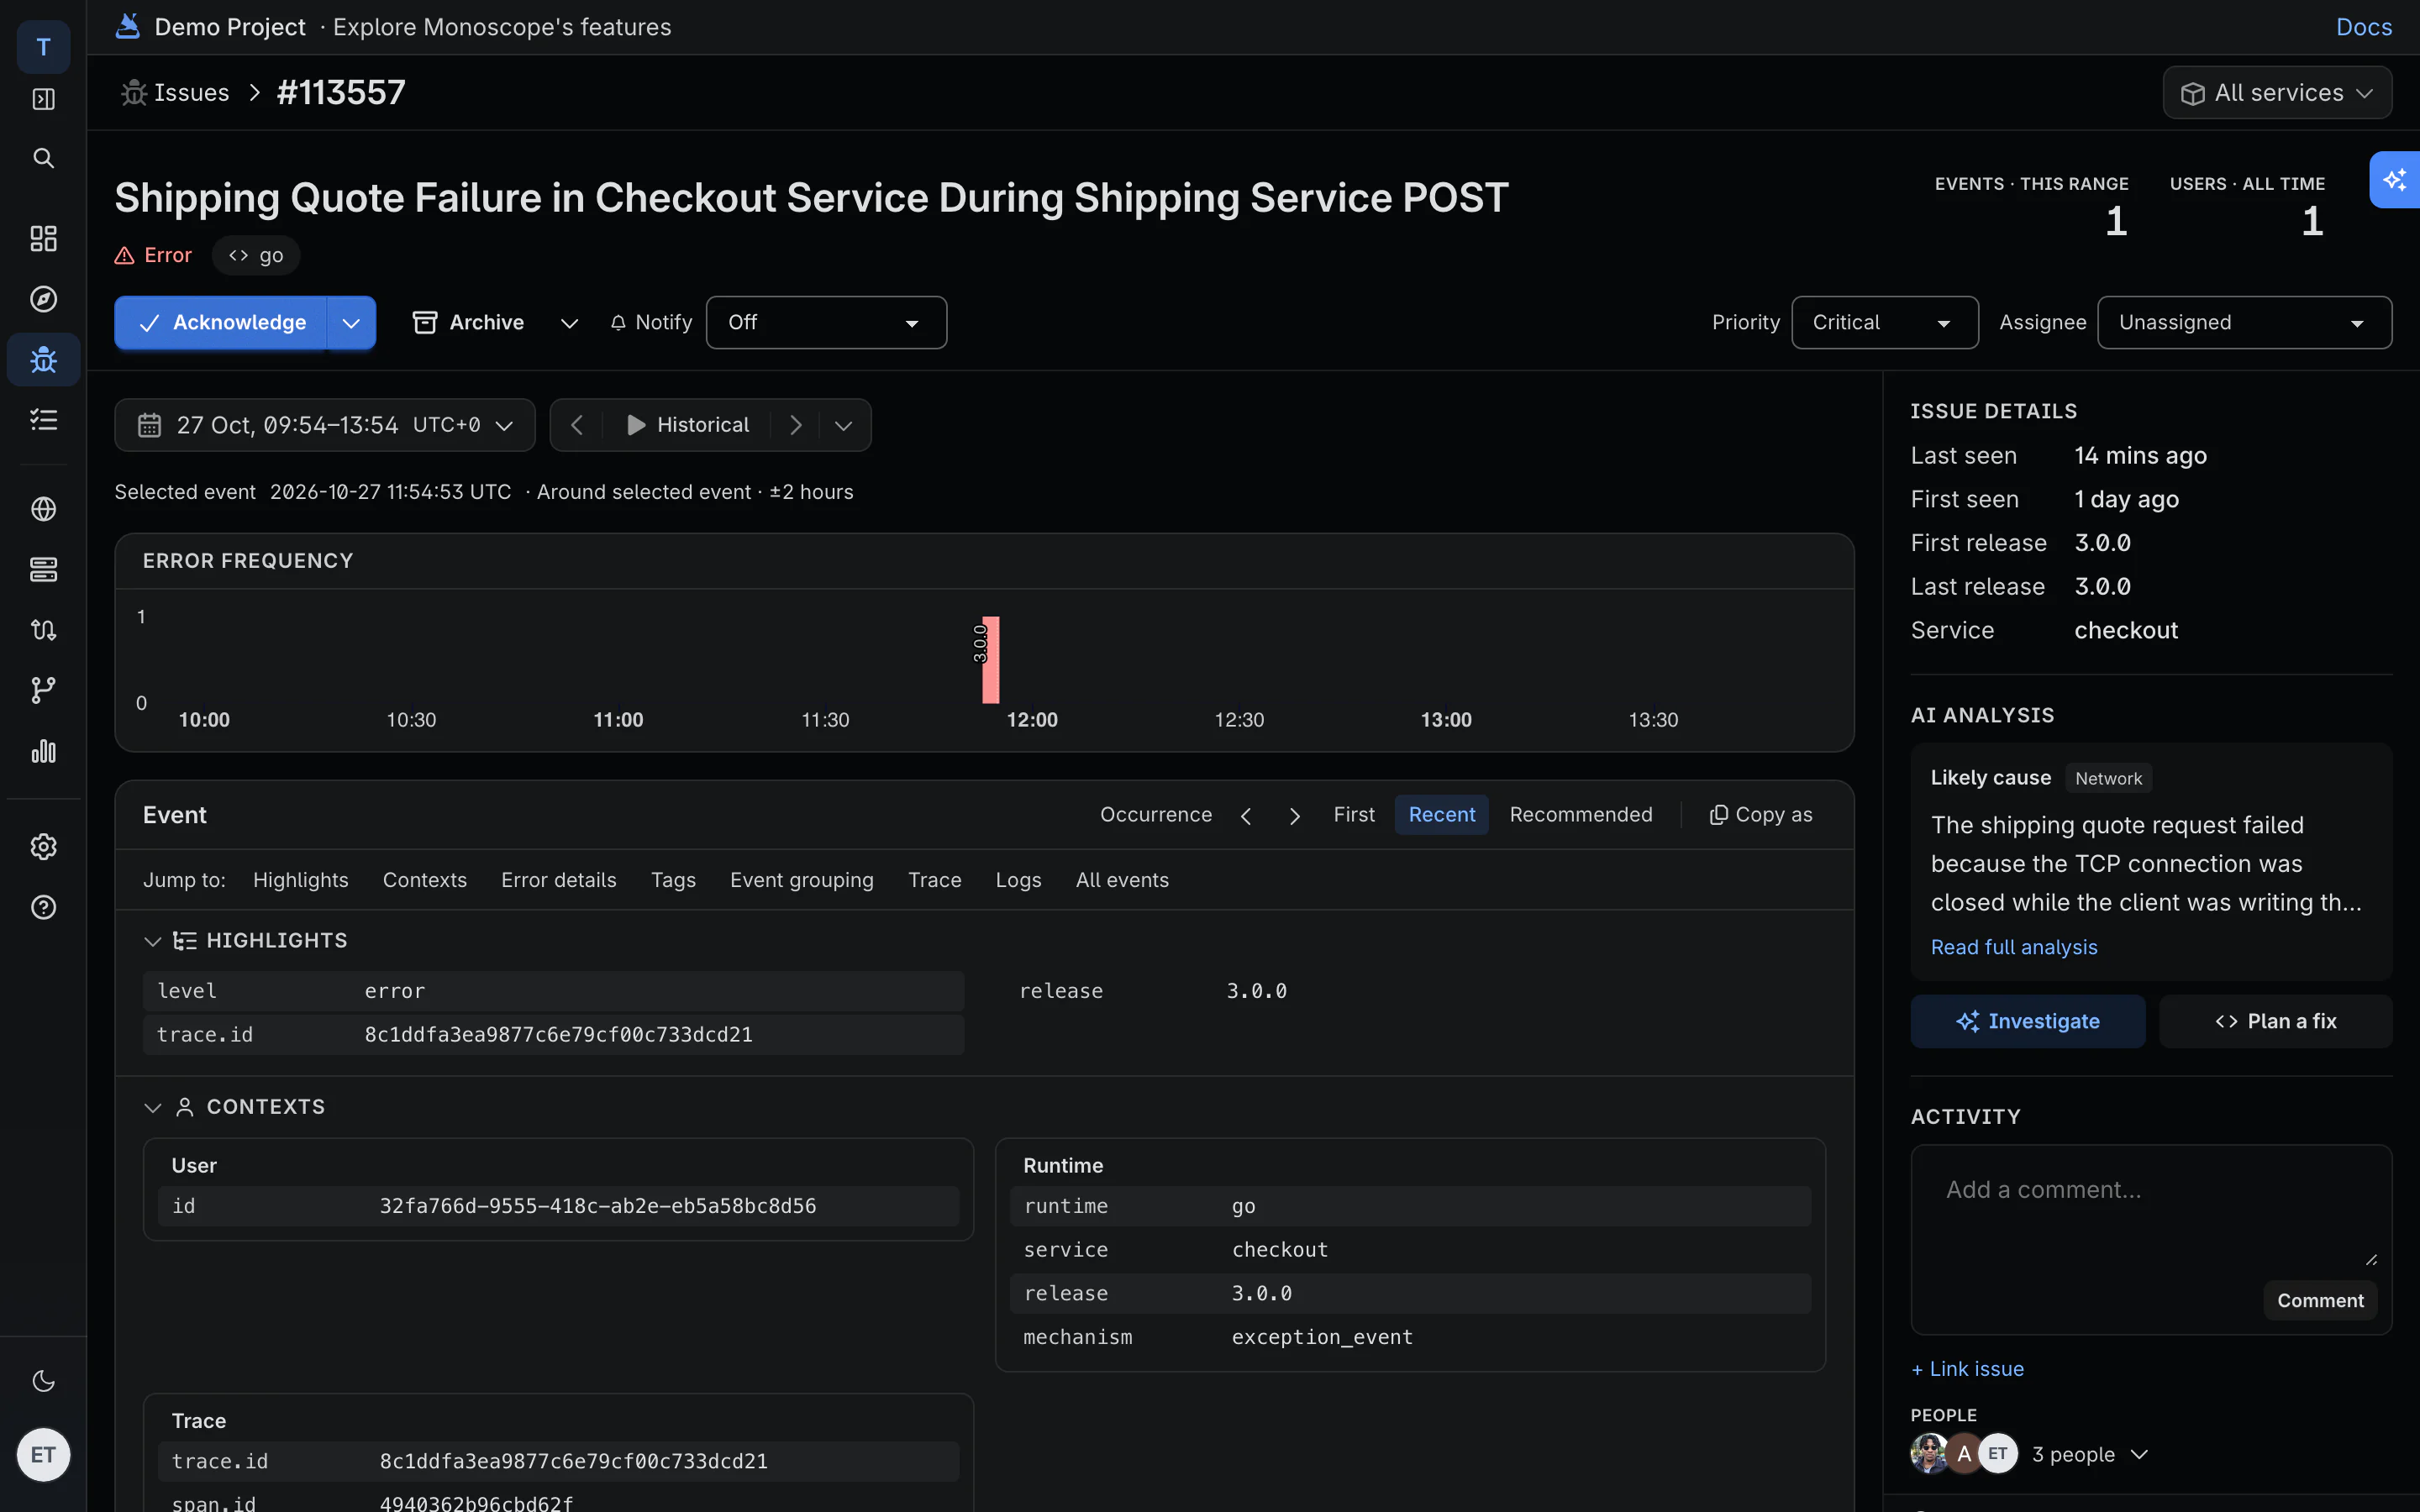
- Inline replay. The issue page shows the session replay in its own section with the console open. Stack traces and activity expand to the full message.
- Log pattern issues. A level chip, activity beside the chart, the Logs tab open by default, and a real captured log line as the sample.
- Error patterns. Patterns from error events get a red badge, and their Slack, Discord, email and PagerDuty alerts are titled by severity. Slack alerts include the sample message.
- A link to an issue that doesn’t exist opens a proper not-found page.
AI SRE
- Issue titles, descriptions and severity are written for every kind of issue, not only API changes. Log and error text is kept apart from the AI’s instructions, so it can’t steer the output.
Logs & Traces
-
OpenTelemetry fields. The filter sidebar lists real OpenTelemetry fields (
http.request.method,service.name, severity and others) with their values. A field with no data in the window says so instead of disappearing. -
Real client IPs. When a span has no
client.address, monoscope fills it in from proxy and CDN headers such as Cloudflare’s andX-Forwarded-For. - Structured logs. JSON, logfmt, syslog, Serilog and GELF logs are parsed into fields and a severity at the bundled collector.
-
Searches on
exception.type,exception.messageandexception.stacktracereturn results. - Plain-text bodies keep their indentation, clipped cells show in full on hover, and long lists scroll more smoothly.
Dashboards & Metrics
- The overview’s slow queries widget groups similar queries and shows the full SQL on hover.
Session Replay
- Fixed replays that played as a black screen.
Monitors & Alerts
- Fewer noisy alerts: known or empty endpoints no longer raise new-endpoint alerts, and API change notifications are rate-limited per issue.
Onboarding & Billing
- Billing settings break usage down into events, metrics and data size.
- The app is available in Spanish. Switch language from the user menu.
Self-Hosting
- The Docker Compose override example has opt-in persistent storage and a local MinIO for S3-compatible storage. The repository has a contributing guide.