CLI, MCP & Agents
-
REST API.
/api/v1with API-key auth covers monitors, dashboards, API keys, events, metrics, issues, log patterns, endpoints, projects, teams, members and share links. -
CLI. The first
monoscopeCLI release: commands for each of those resources, YAML definitions you can apply, shell completion, prebuilt binaries and an install script. - Skills for coding agents. A Claude Code skills plugin and full CLI docs.
Logs & Traces
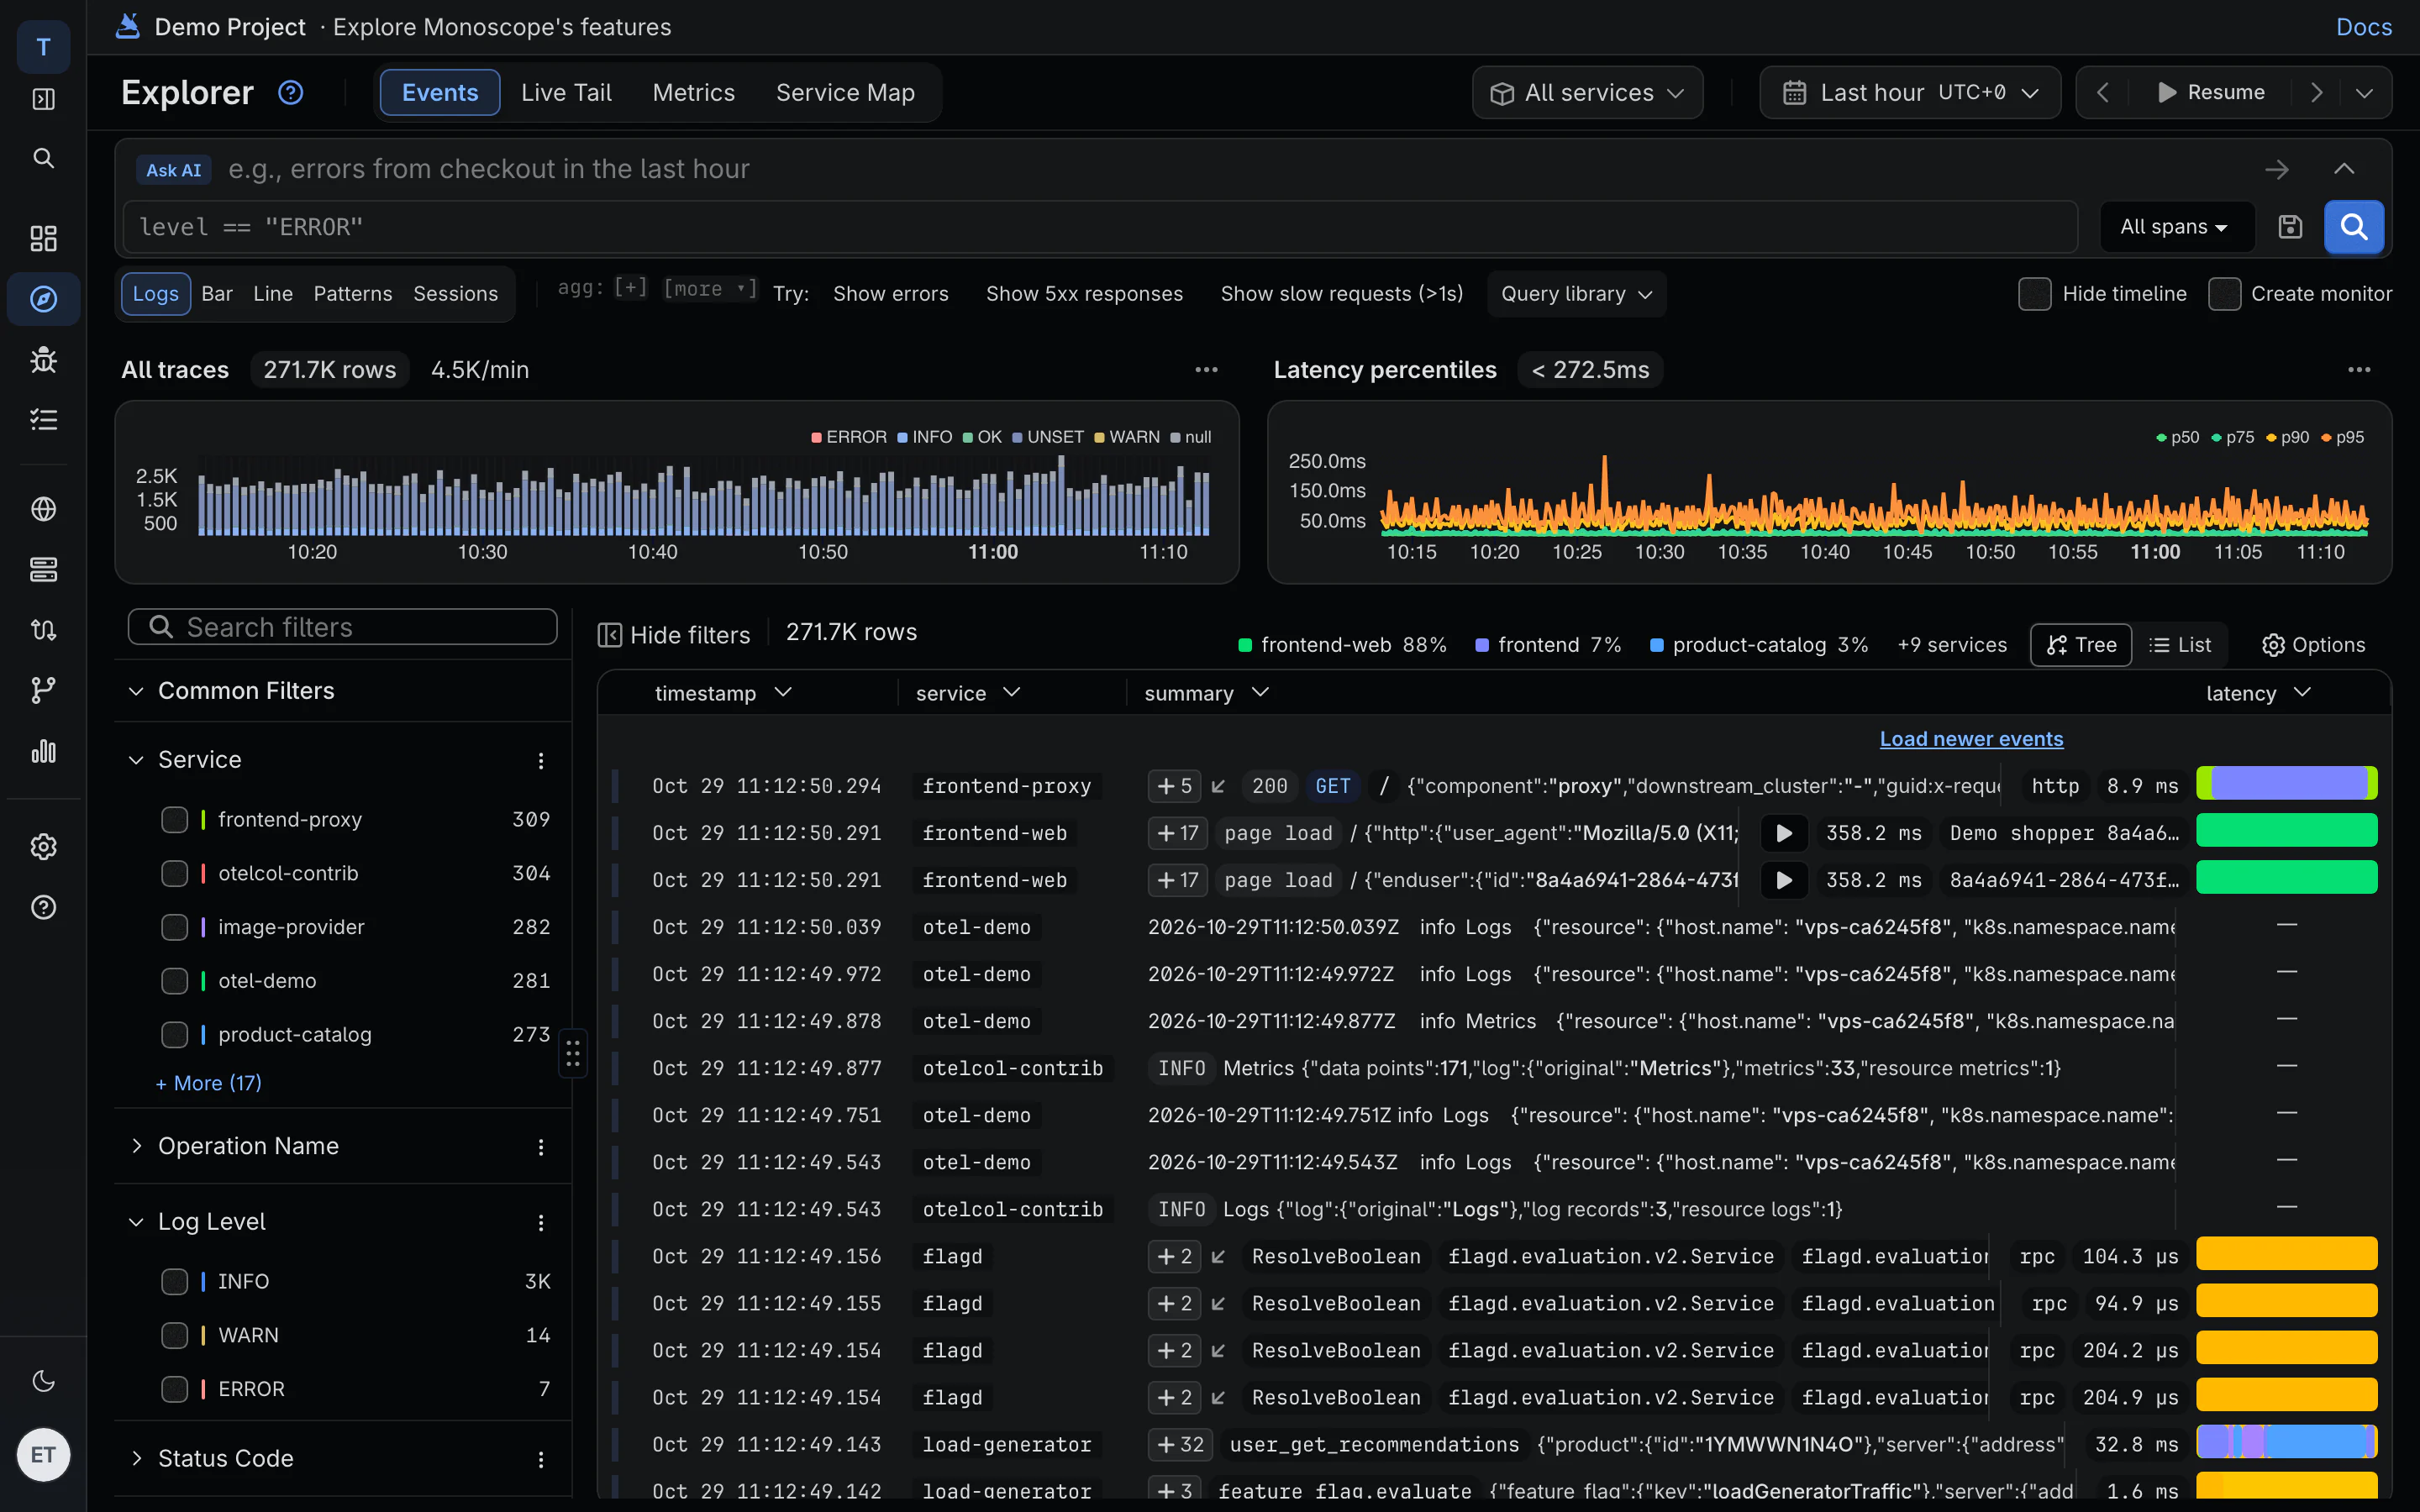
- Sessions view. Spans grouped by session, with user, event and error counts, duration and a sparkline. Expand a session into its traces. A summary strip shows sessions with errors and p95 duration, with a chart of clean and failed sessions over time.
- Identity across a trace. A user or tenant set on one span carries to every span in the trace. Span details show name, email, user ID and session ID.
- Query editor. Suggestions from your real values, a library of saved and popular searches, and inline parse errors.
- Waterfall. Spans are labeled with the query, route or RPC method, and the timeline resizes. Browser spans are labeled as page load, fetch, navigation, click, long task or web vital.
- Spans whose parent never arrived group under one placeholder, and latency bars are corrected for clock skew.
Monitors & Alerts
- Clearer alerts. Slack and Discord alerts carry a severity color, the top stack frame, a View trace button and signed percentage changes.
- Still firing. Repeat alerts say how long the problem has lasted, without duplicates.
- Teams are alerted for new log pattern, rate change and runtime error issues, not only in the inbox. Remove one person from alert emails without removing them from the project.
- Monitors use their configured time window, recover when results are empty, and show the right current value.
Issues
- Browser errors. Errors from browser SDKs go through the same issue pipeline as backend errors.
- Rolled-up errors. Connection resets and similar framework errors become one issue instead of one per route.
- Quieter inbox. Groups of similar log pattern issues collapse into one row, and stale discovery issues archive after 14 days.
- New endpoint pages. Request trend, endpoint details, field changes and the originating trace.
- The API catalog has Incoming, Outgoing and Archived tabs, accurate per-host counts, and the services that serve or call each host.
- User clicks, console events and navigation before an error show in the issue’s activity panel.
Session Replay
- The play button has a red border when the session had errors. Missing pieces no longer break a whole recording.
Integrations
- Slack alerts can go to private channels, and chart images render inline.
Onboarding & Billing
- New paid subscriptions start with a 30-day trial, with reminders 7 and 3 days before it ends.
- The sidebar has flyout menus for Explorer, API Catalog, Issues, Monitors and Settings.
- Deleting a project asks for confirmation.
Self-Hosting
-
DATABASE_URLaccepts keyword/value connection strings such ashost=... sslmode=disable. - Crashed service threads restart on their own.