Monitors & Alerts
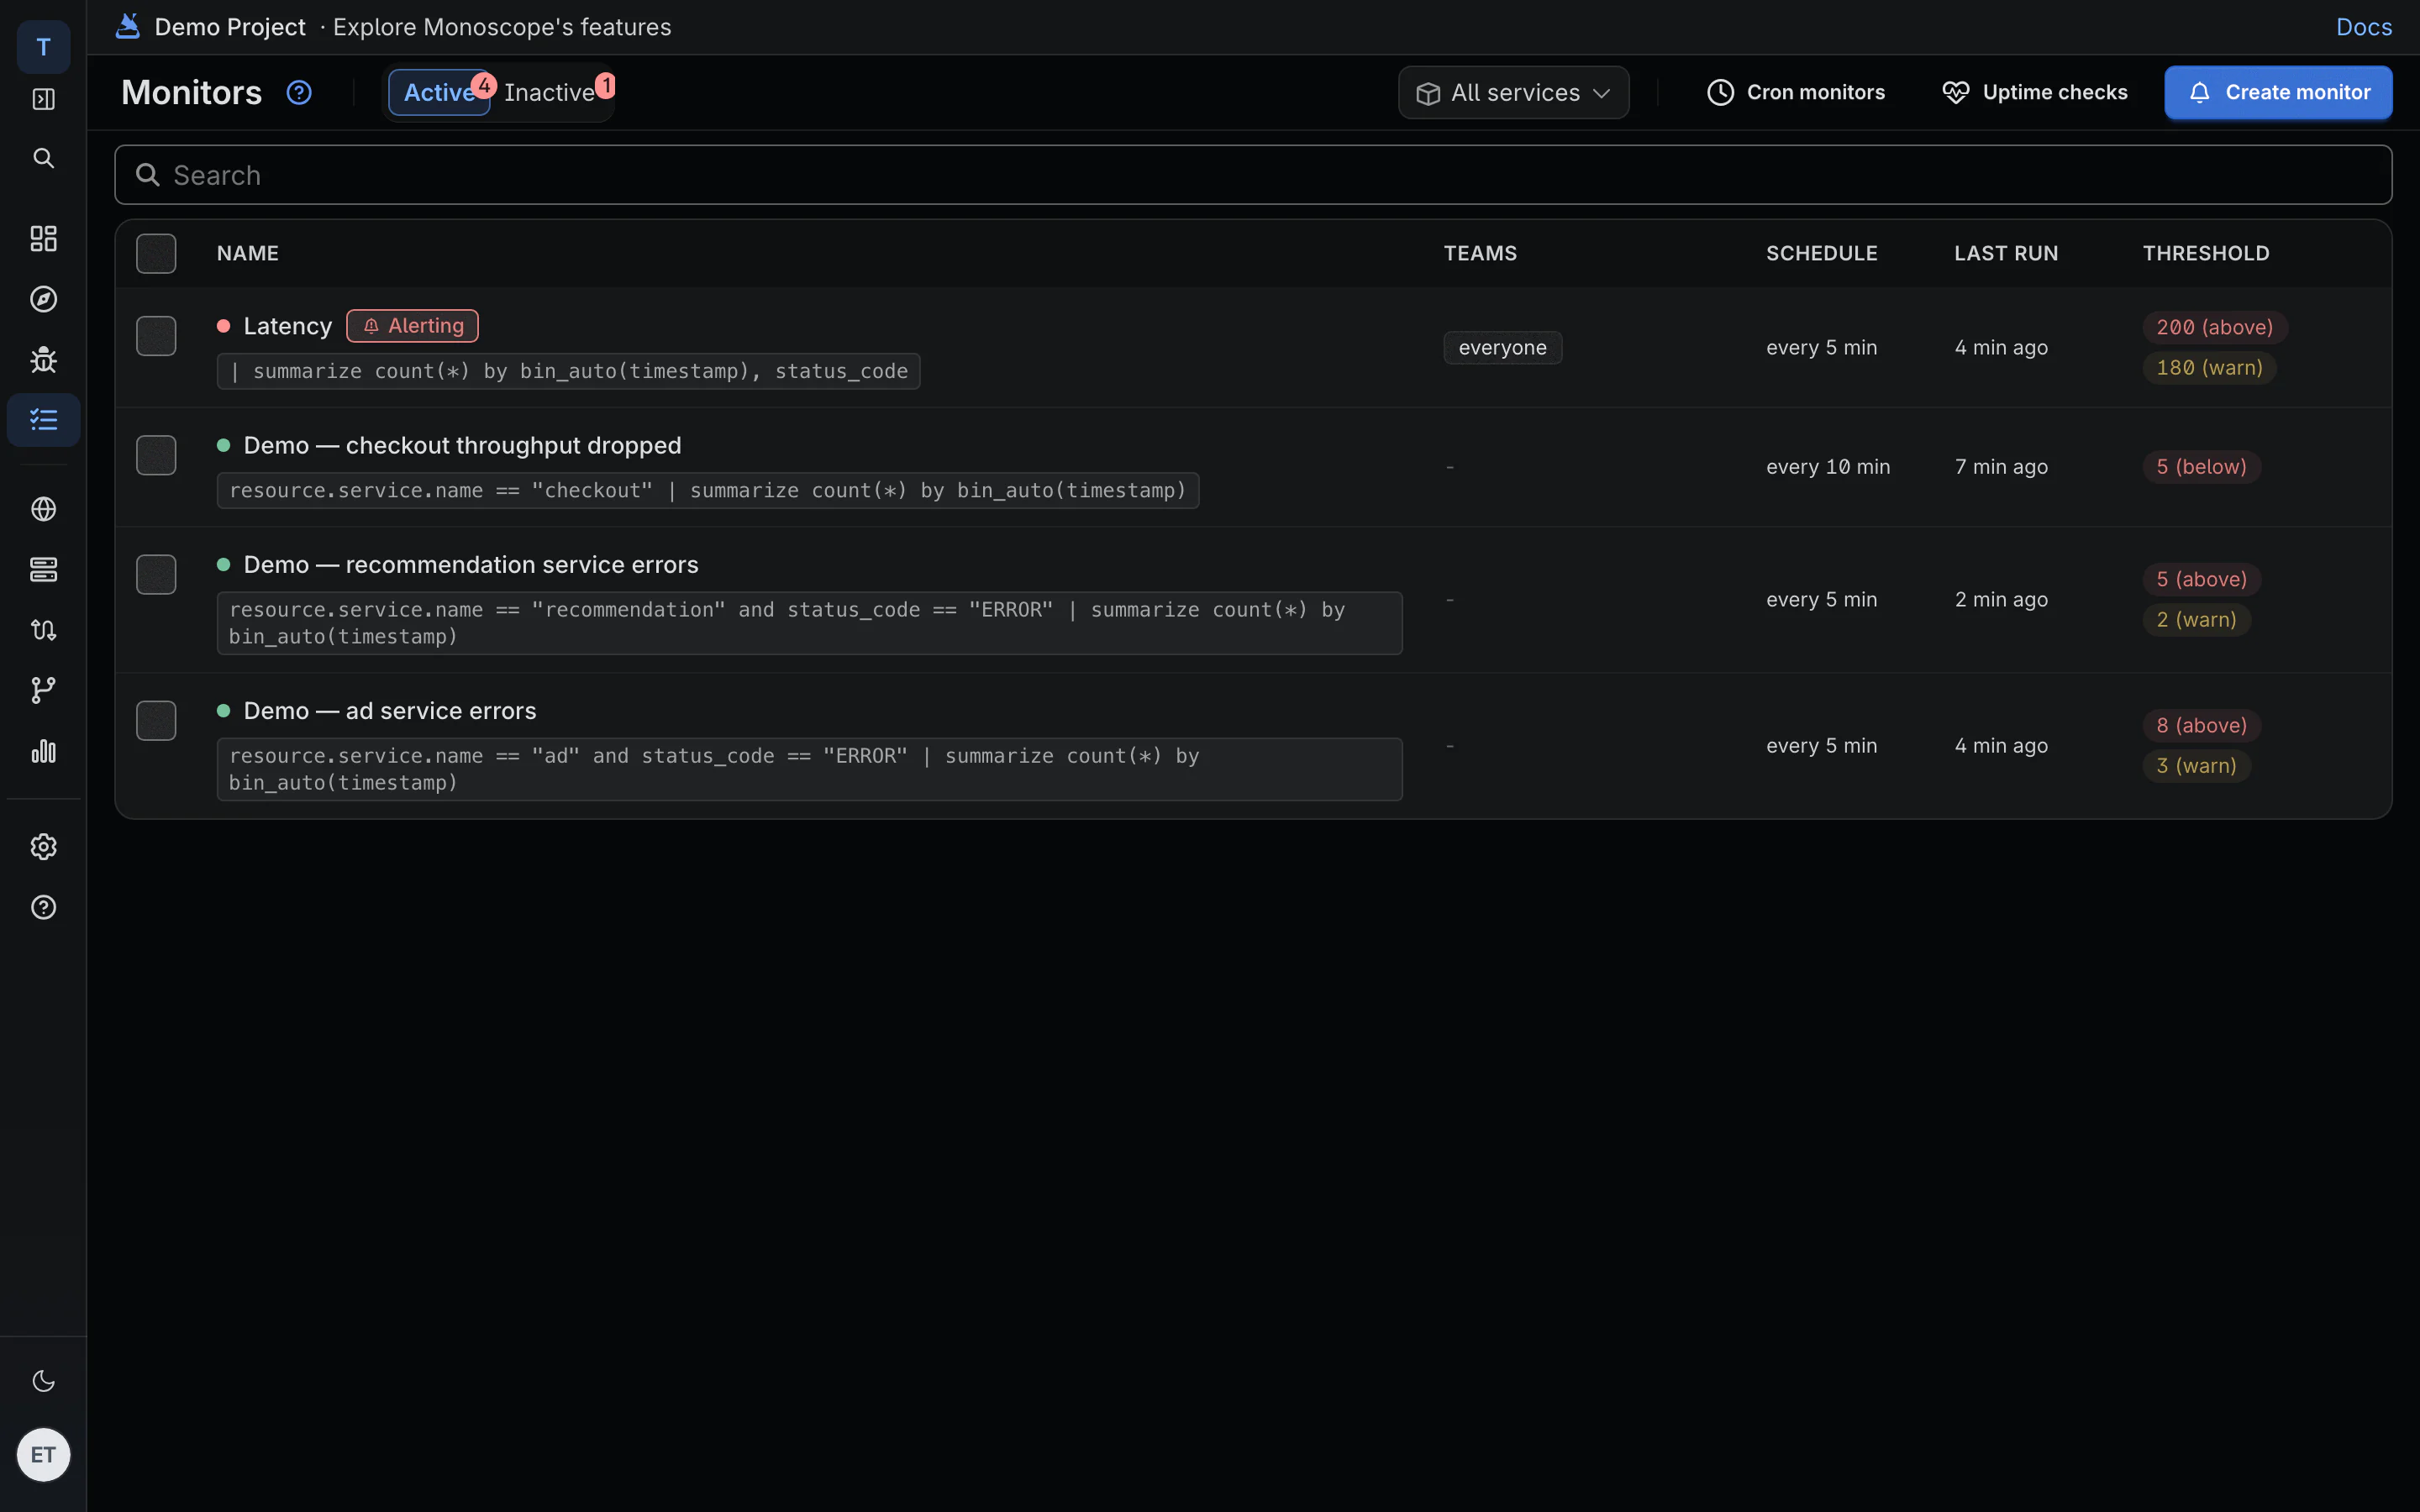
- Monitors that fire. Query monitors evaluate on schedule and notify. Set how often a monitor re-notifies and when it stops, and get alert and recovery emails.
- Chart-first detail page. Threshold lines, a time picker, a details sidebar, and mute, resolve and deactivate actions. Alerts are now called Monitors across the app.
- Charts in alerts. Slack, Discord, email and PagerDuty alerts include a trend chart and occurrence counts.
- The monitors list puts alerting monitors first and shows short relative run times. Duplicate notification emails are gone.
Issues
- Less noise. Issues open only for error and warning log patterns. Infrastructure noise is skipped, identical errors merge first, and regression alerts repeat less.
-
Issues page. Severity colors and icons, a short
#Nnumber for each issue that you can search by, an activity log, and syntax-highlighted code. - Log pattern issues show a 7-day volume chart, with event counts over 24 hours or 7 days.
-
Cleaner endpoints. Paths with IDs merge into templates such as
/users/{id}, so the API catalog stops filling with duplicates. - Plain OpenTelemetry. The API catalog picks up standard OpenTelemetry HTTP spans, and shows sparklines with a Last Seen column.
Dashboards & Metrics
- Every metric type. Sums, histograms, exponential histograms and summaries are stored, not only gauges, so CPU and memory from infrastructure agents show up. Metric queries are faster.
- Endpoint dashboard. Overview, Errors and Latency tabs, with downstream calls at any depth.
- Built-in dashboards have fewer tabs, table rows open the matching view, and timestamps and tags are easier to read.
- Dashboards work on phones, and reordering widgets can no longer wipe another tab.
Logs & Traces
- Waterfall. Hover tooltips, a time cursor and labeled stats. Clock skew is corrected, so child spans no longer start before their parents.
- Merged patterns. Similar log patterns merge, with a badge showing how many.
- The explorer, onboarding and settings work on phones.
- A command palette, faster facets, and queries on missing columns return empty results instead of an error.
Integrations
-
Send telemetry with an
x-api-keyheader as well asAuthorization. The bundled collector accepts it from browsers. - Integrations live under Settings, Integrations.
Onboarding & Billing
- Weekly reports. Redesigned emails, and the reports page shows each email as sent plus a live week-to-date preview.
- Free projects see a banner and get emails as they approach and reach the daily limit.
- Stripe checkout, and usage-based overage on the bring-your-own-storage plan.
- Removed members can no longer open the project, and a project audit log records critical changes.
Self-Hosting
- Docker Compose runs TimescaleDB on Postgres 18.
- Telemetry is compressed after an hour and deleted after 30 days by default.
-
PAUSE_NOTIFICATIONSturns off monitor, error and endpoint notifications for the whole install.