Product
The AI SRE that keeps its own evidence
monoscope keeps every API request and response, yours and your suppliers', next to your logs, traces and metrics. Its AI reads that record to investigate, answer in Slack and open the fix.
01 · Know · Error tracking
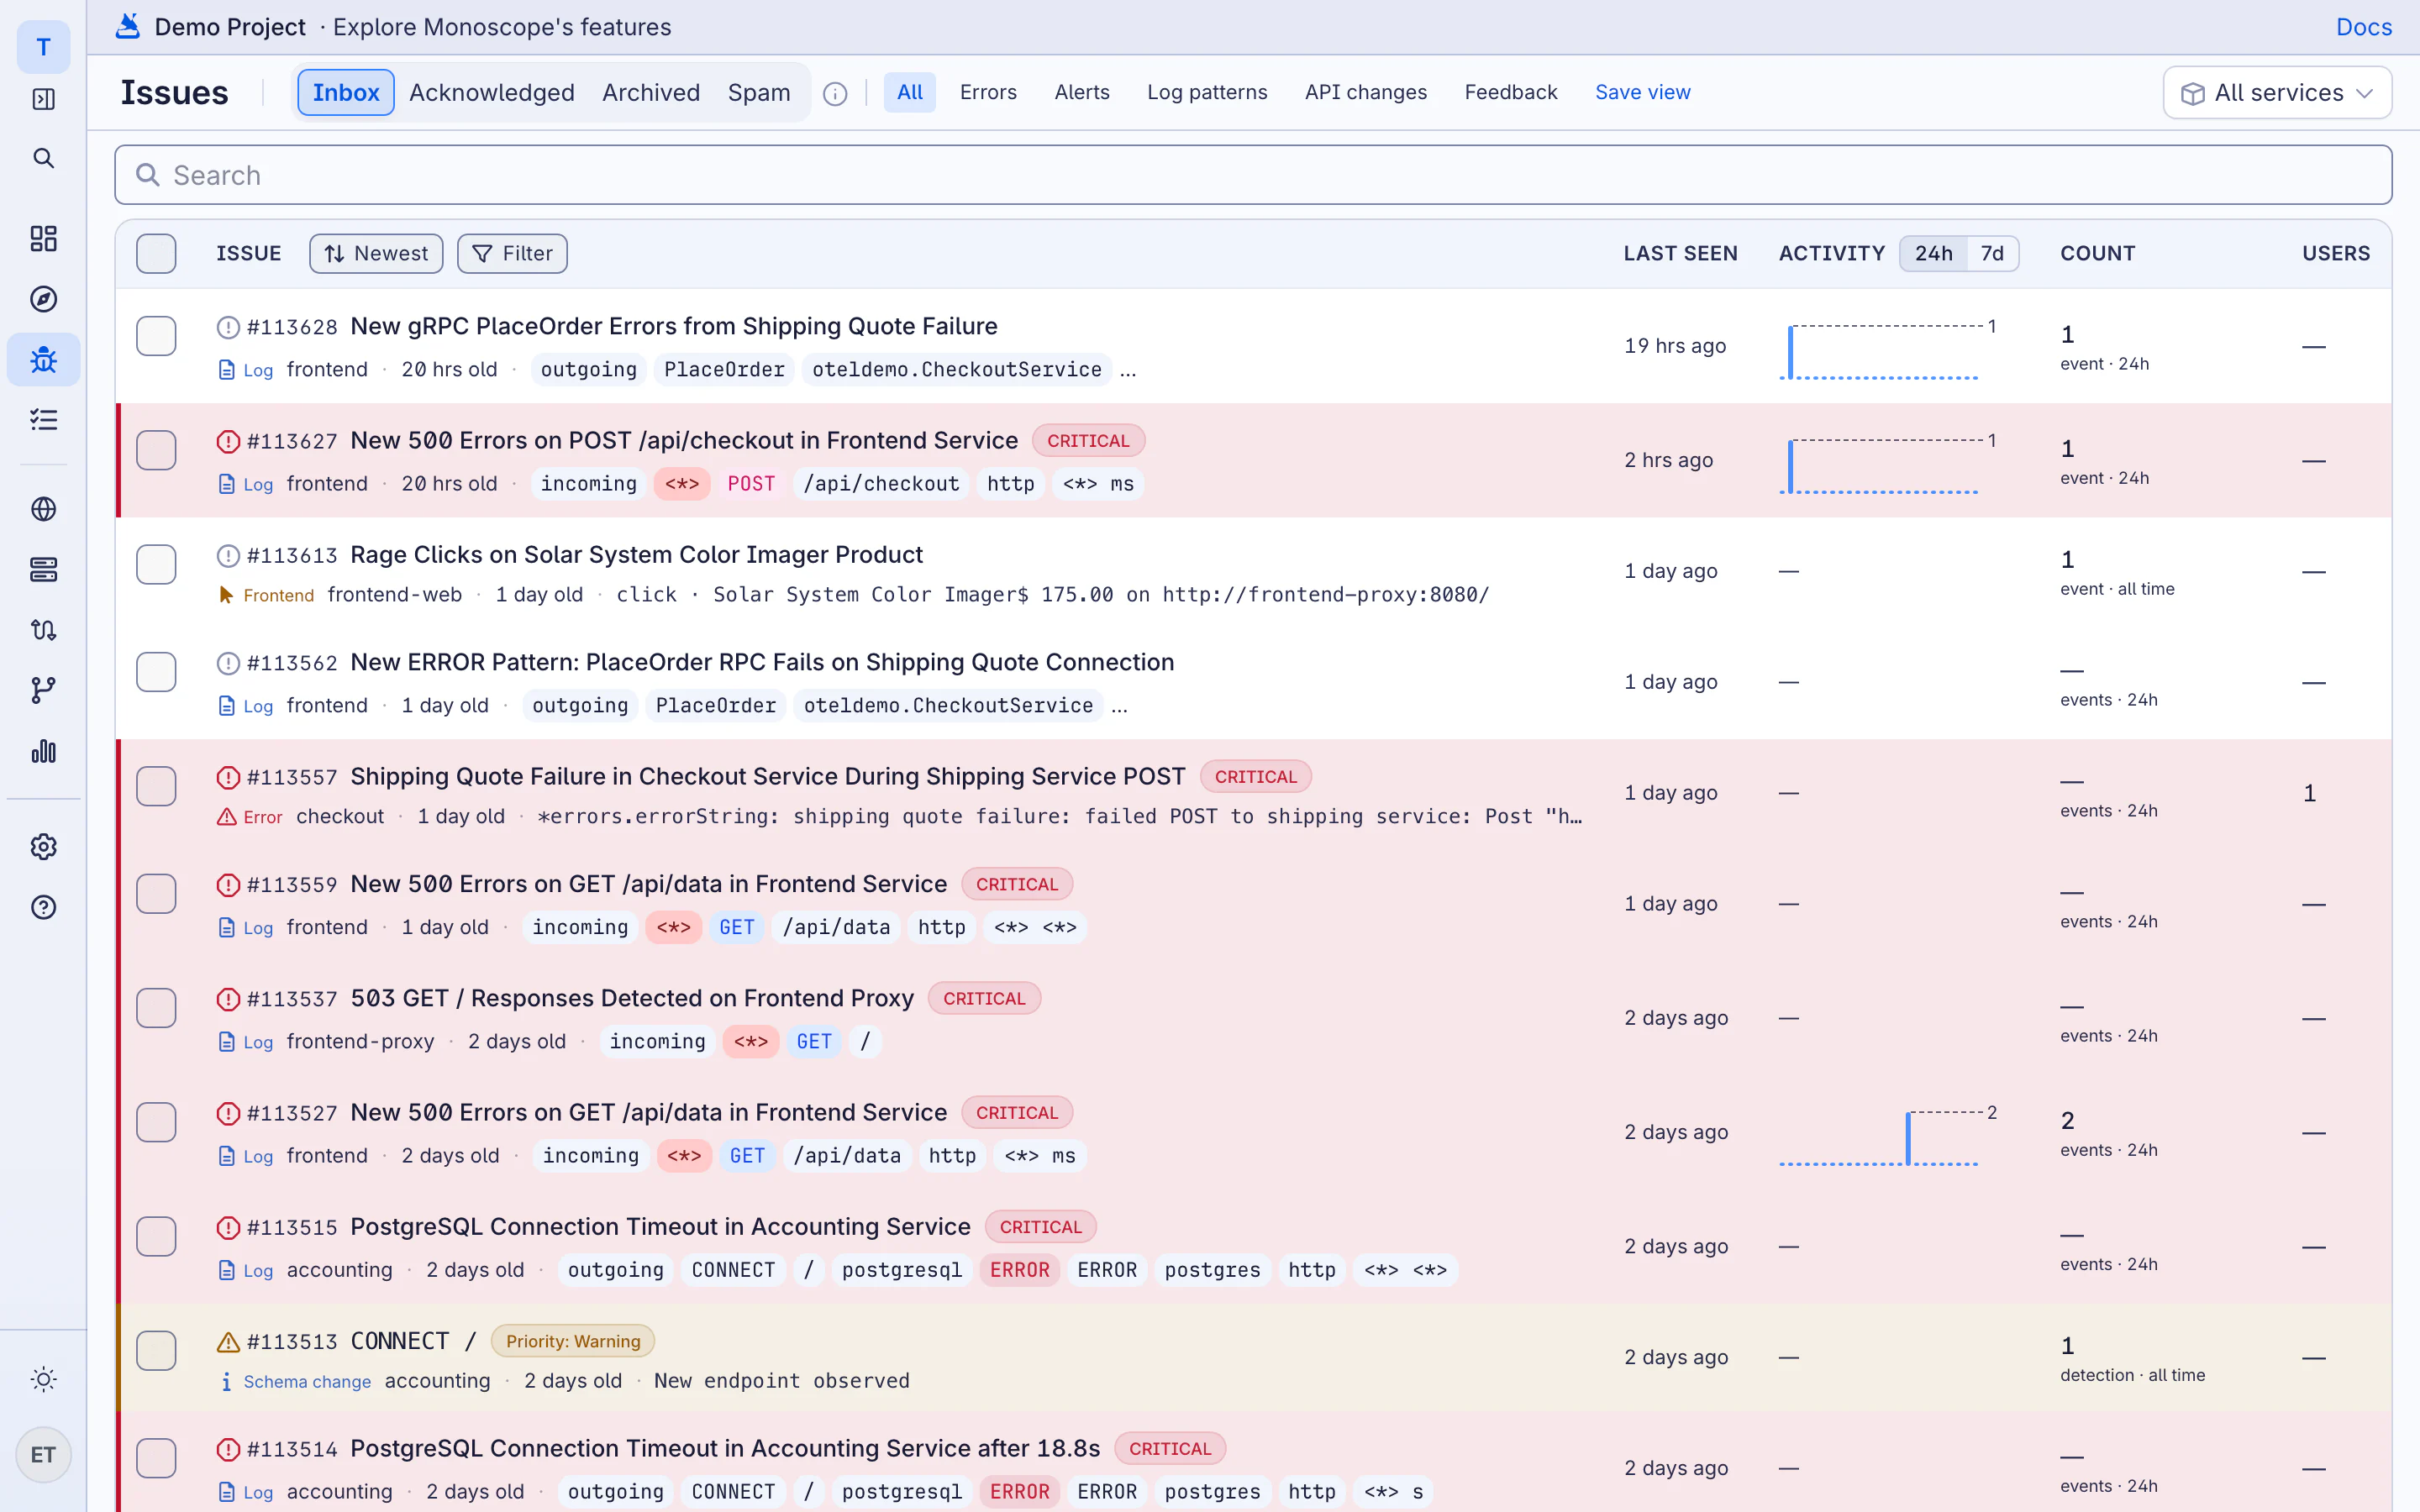
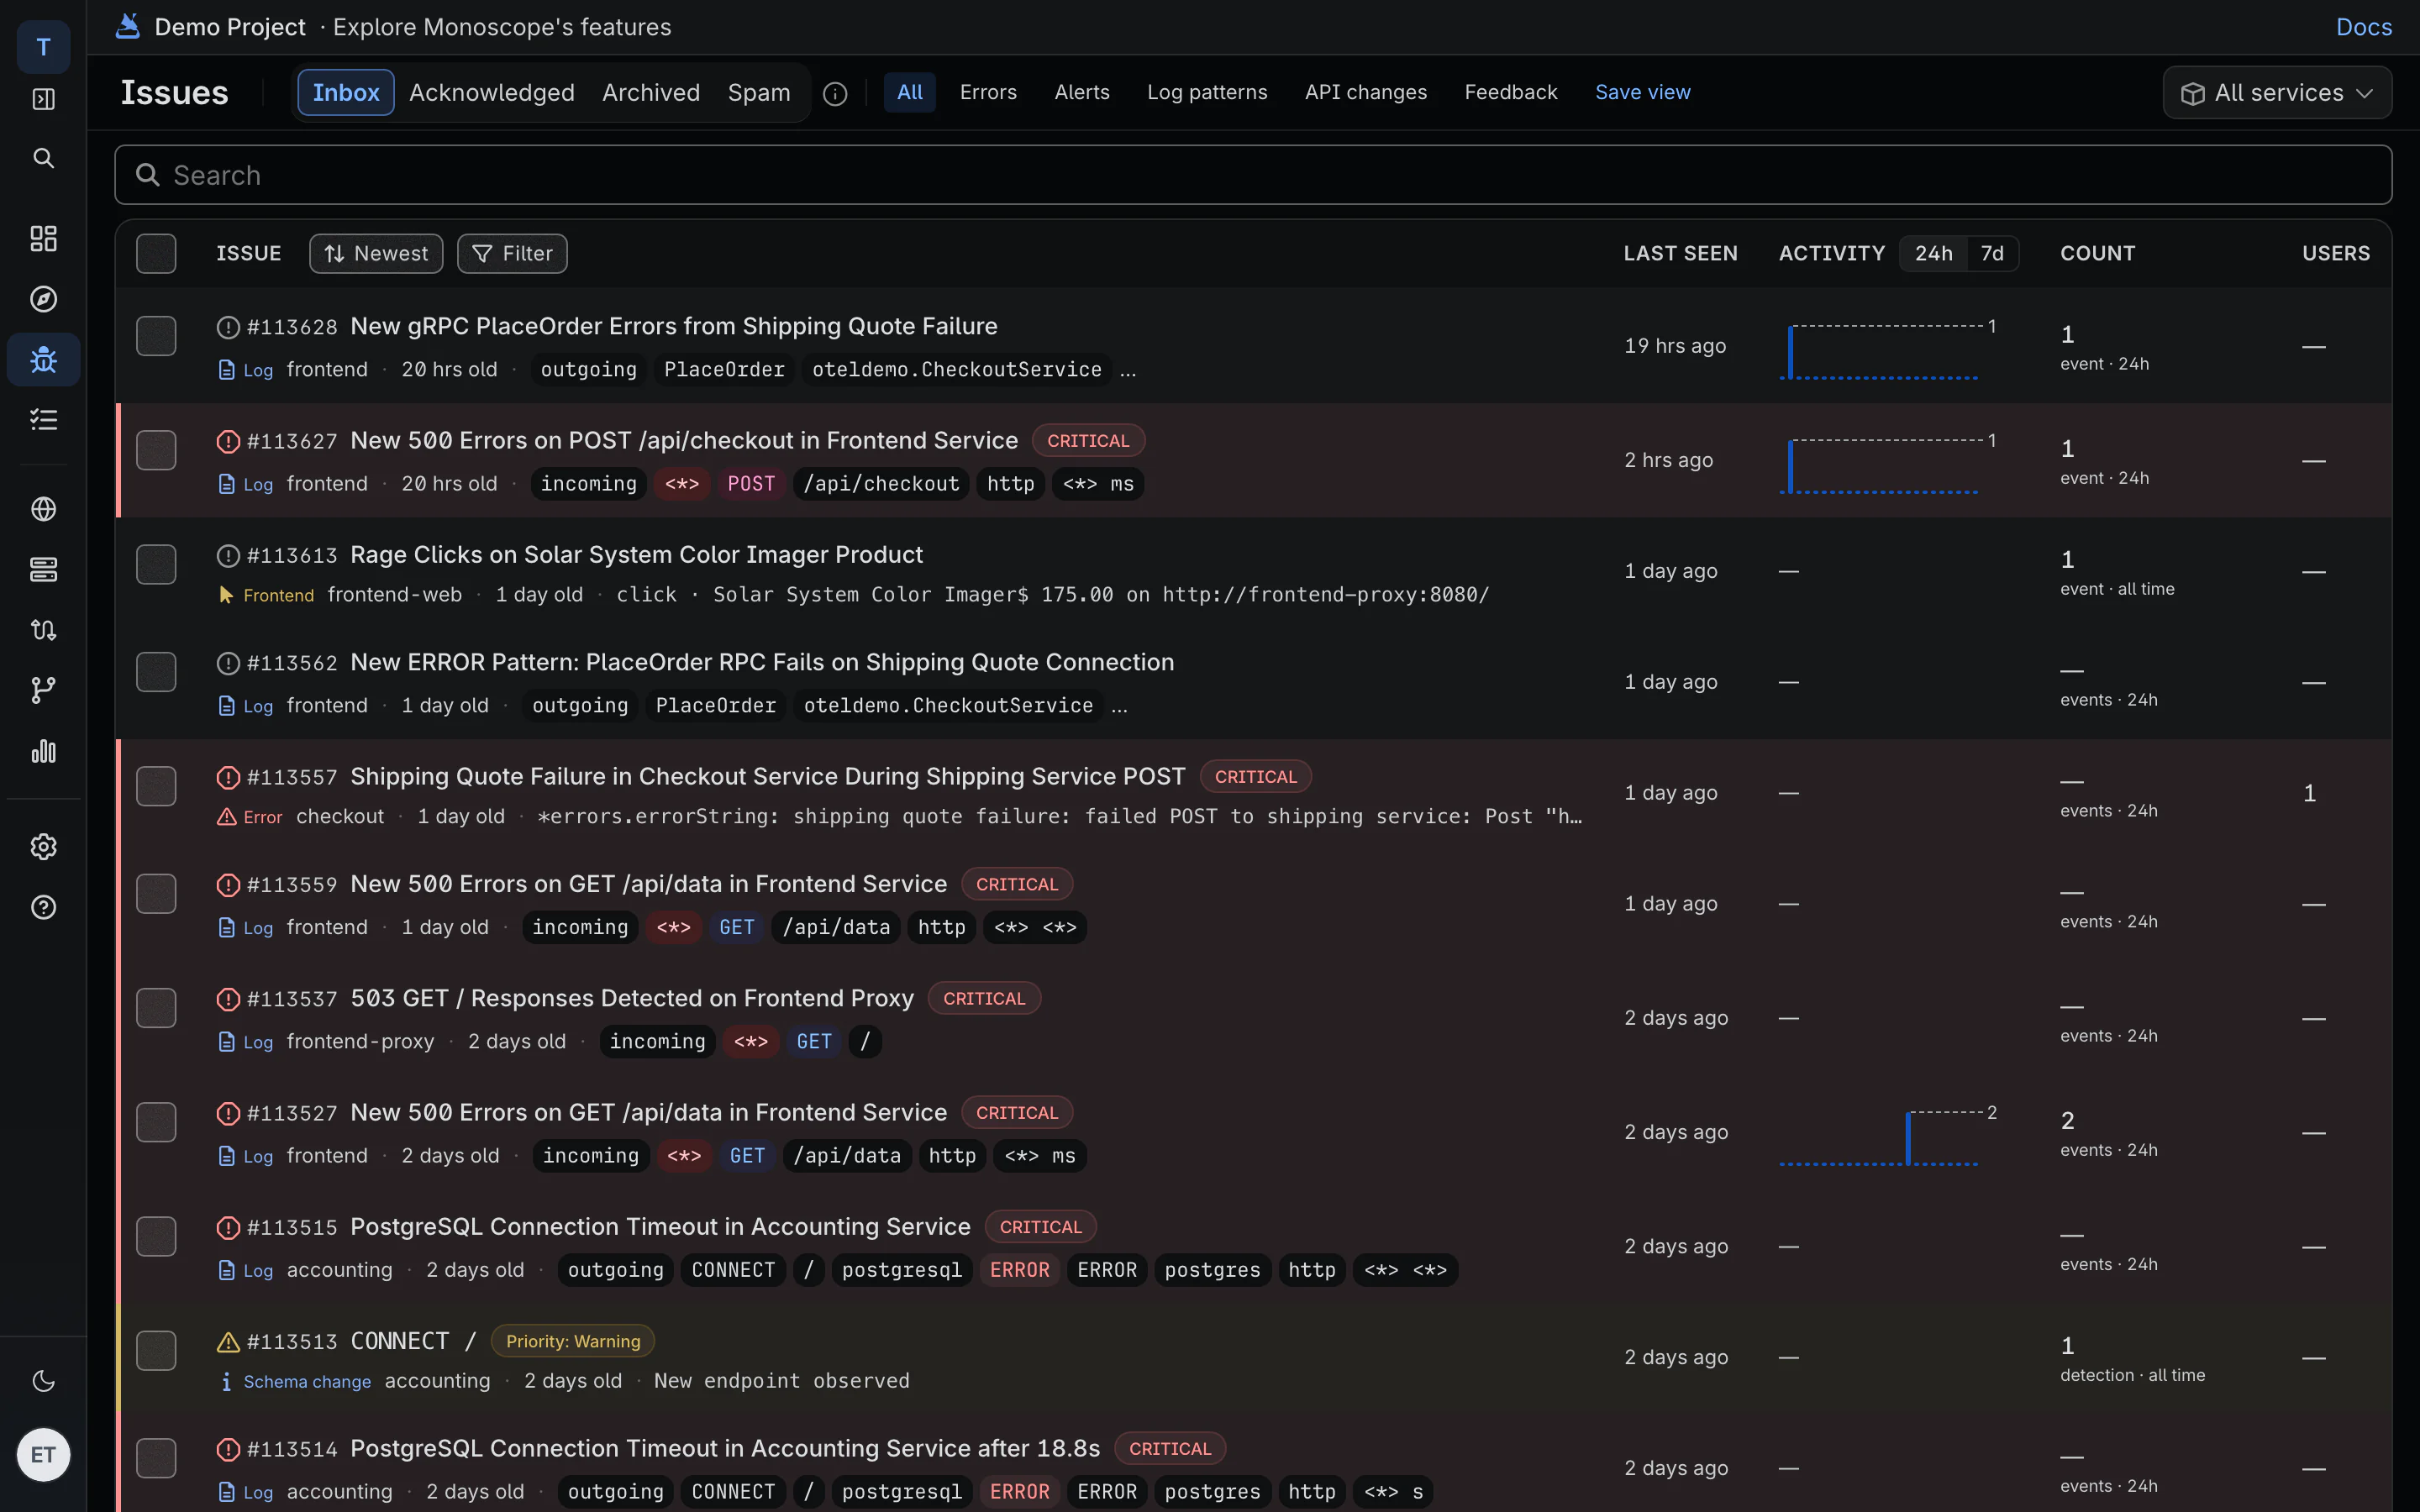
Every error, with the request that caused it
Exceptions, crashes and new log patterns become issues, each with the headers, body and response exactly as they were. Alerts reach Slack, PagerDuty or email before a customer writes in.
02 · Know · API monitoring
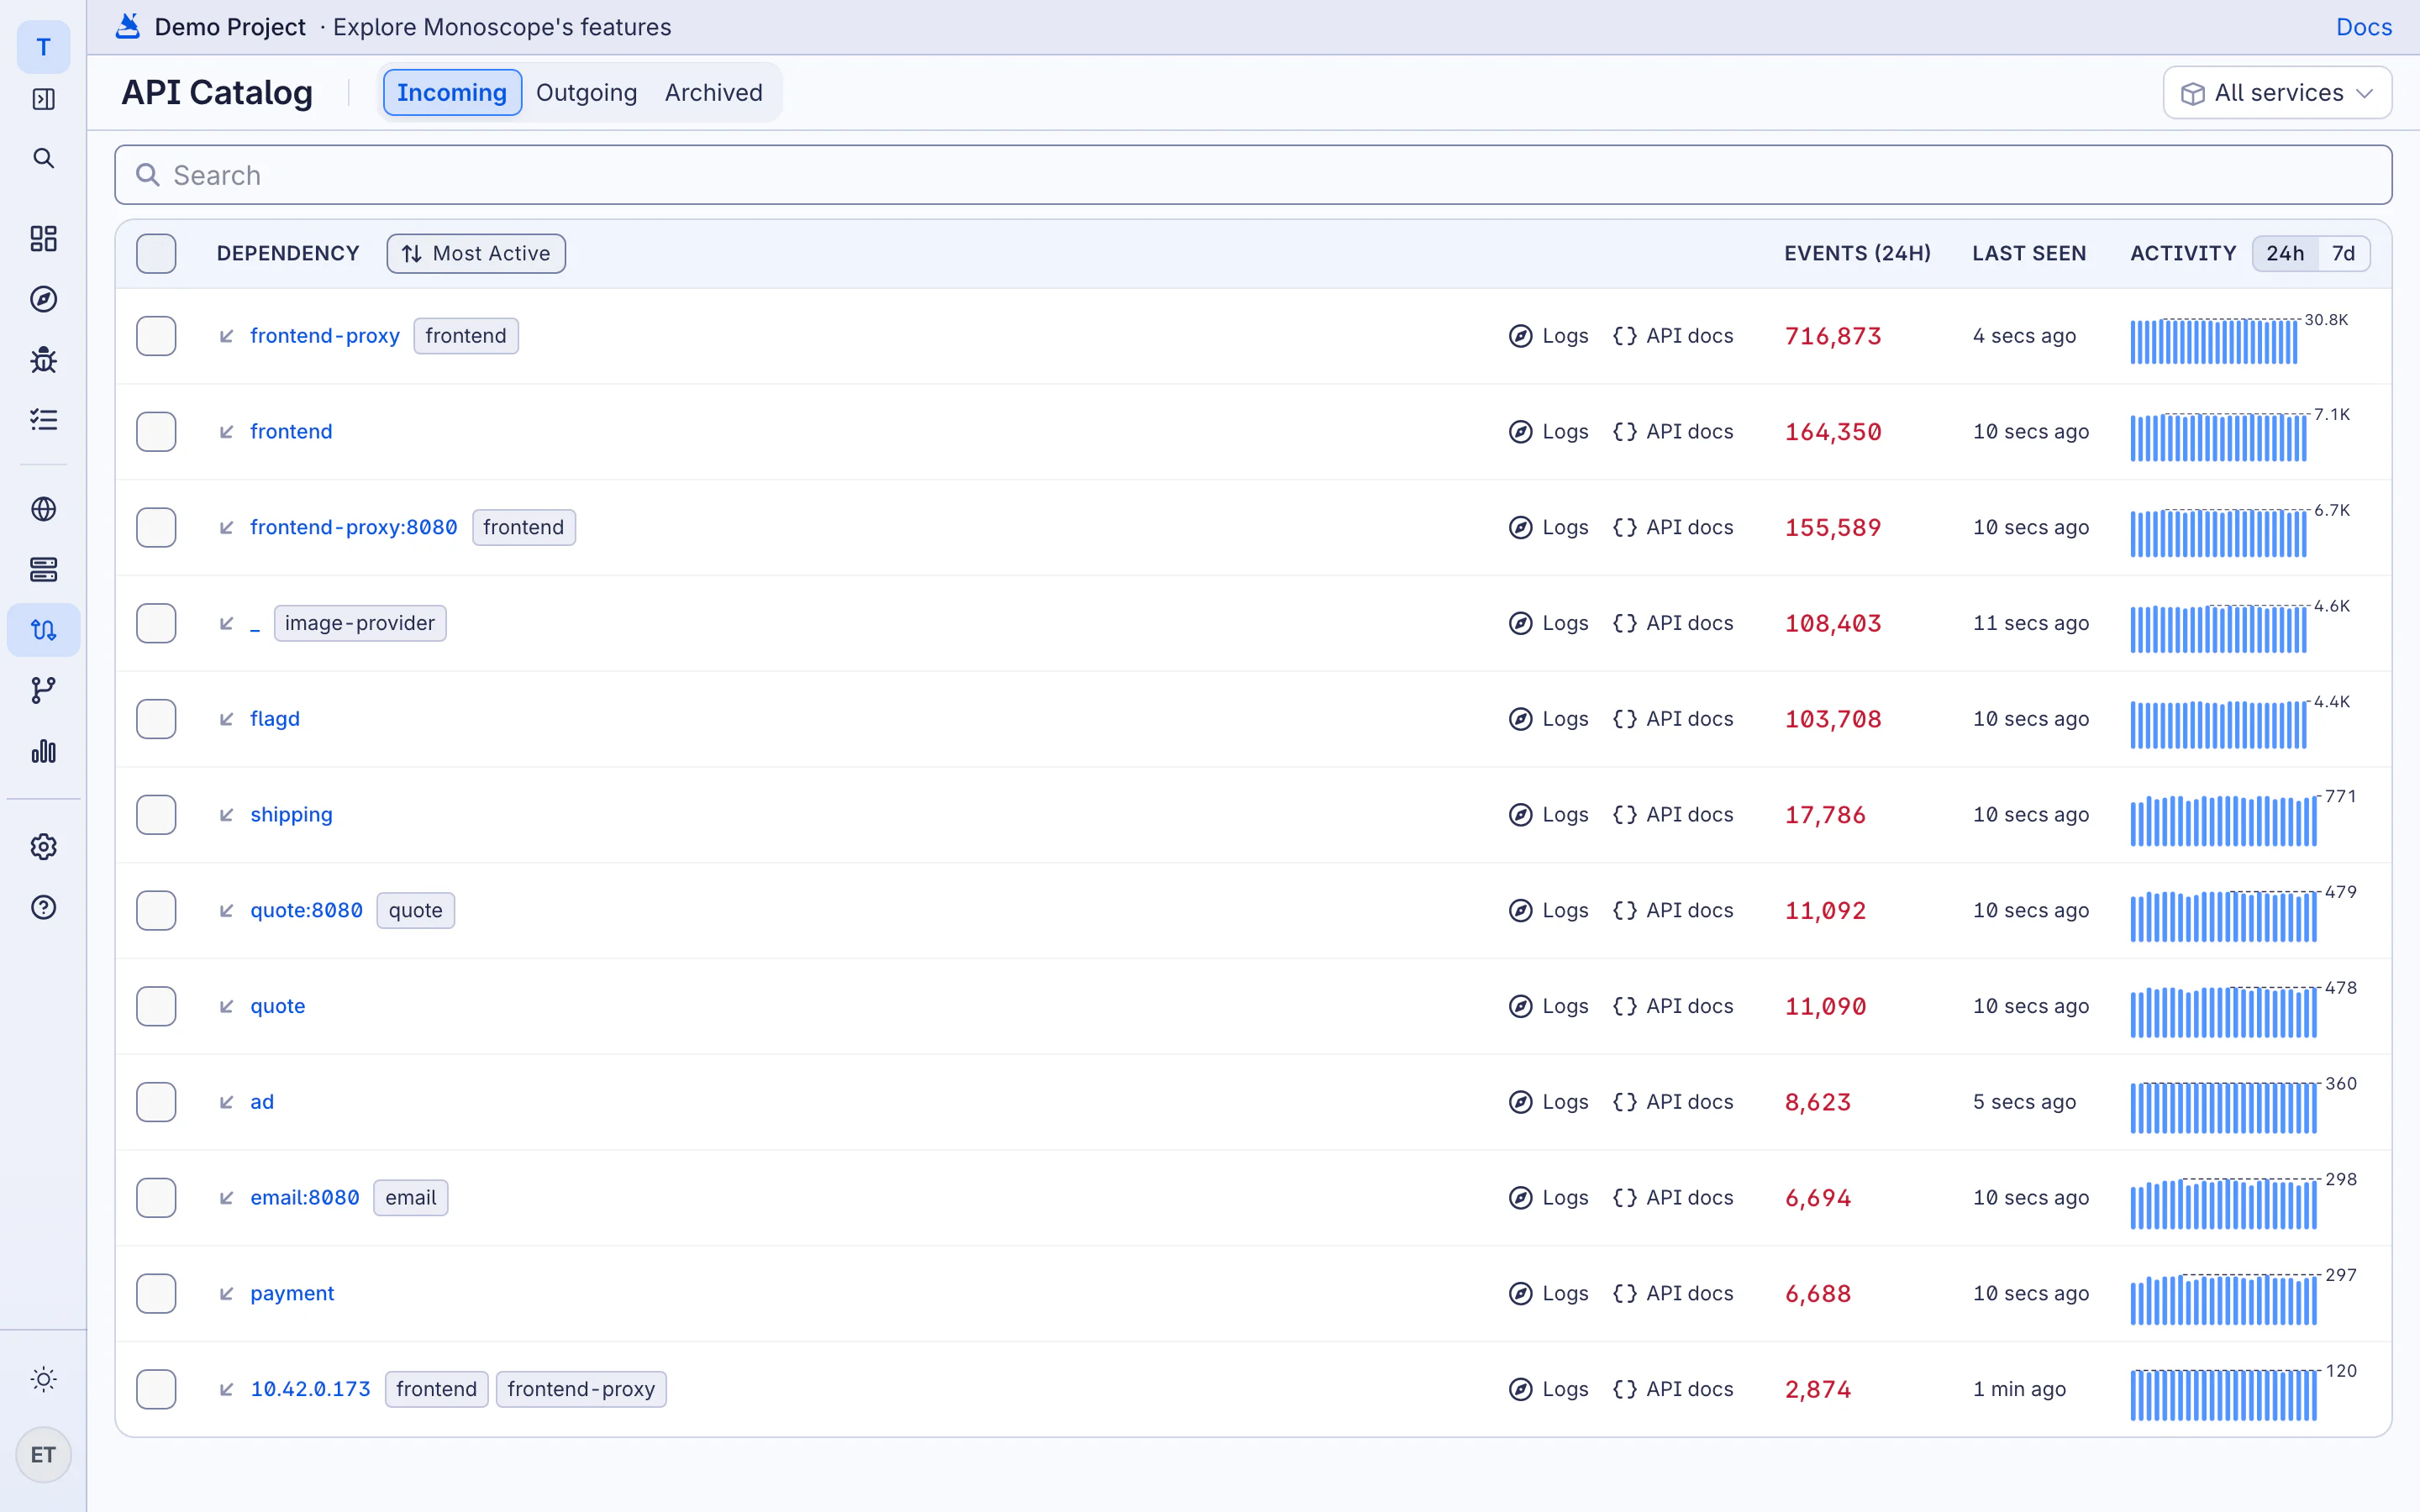
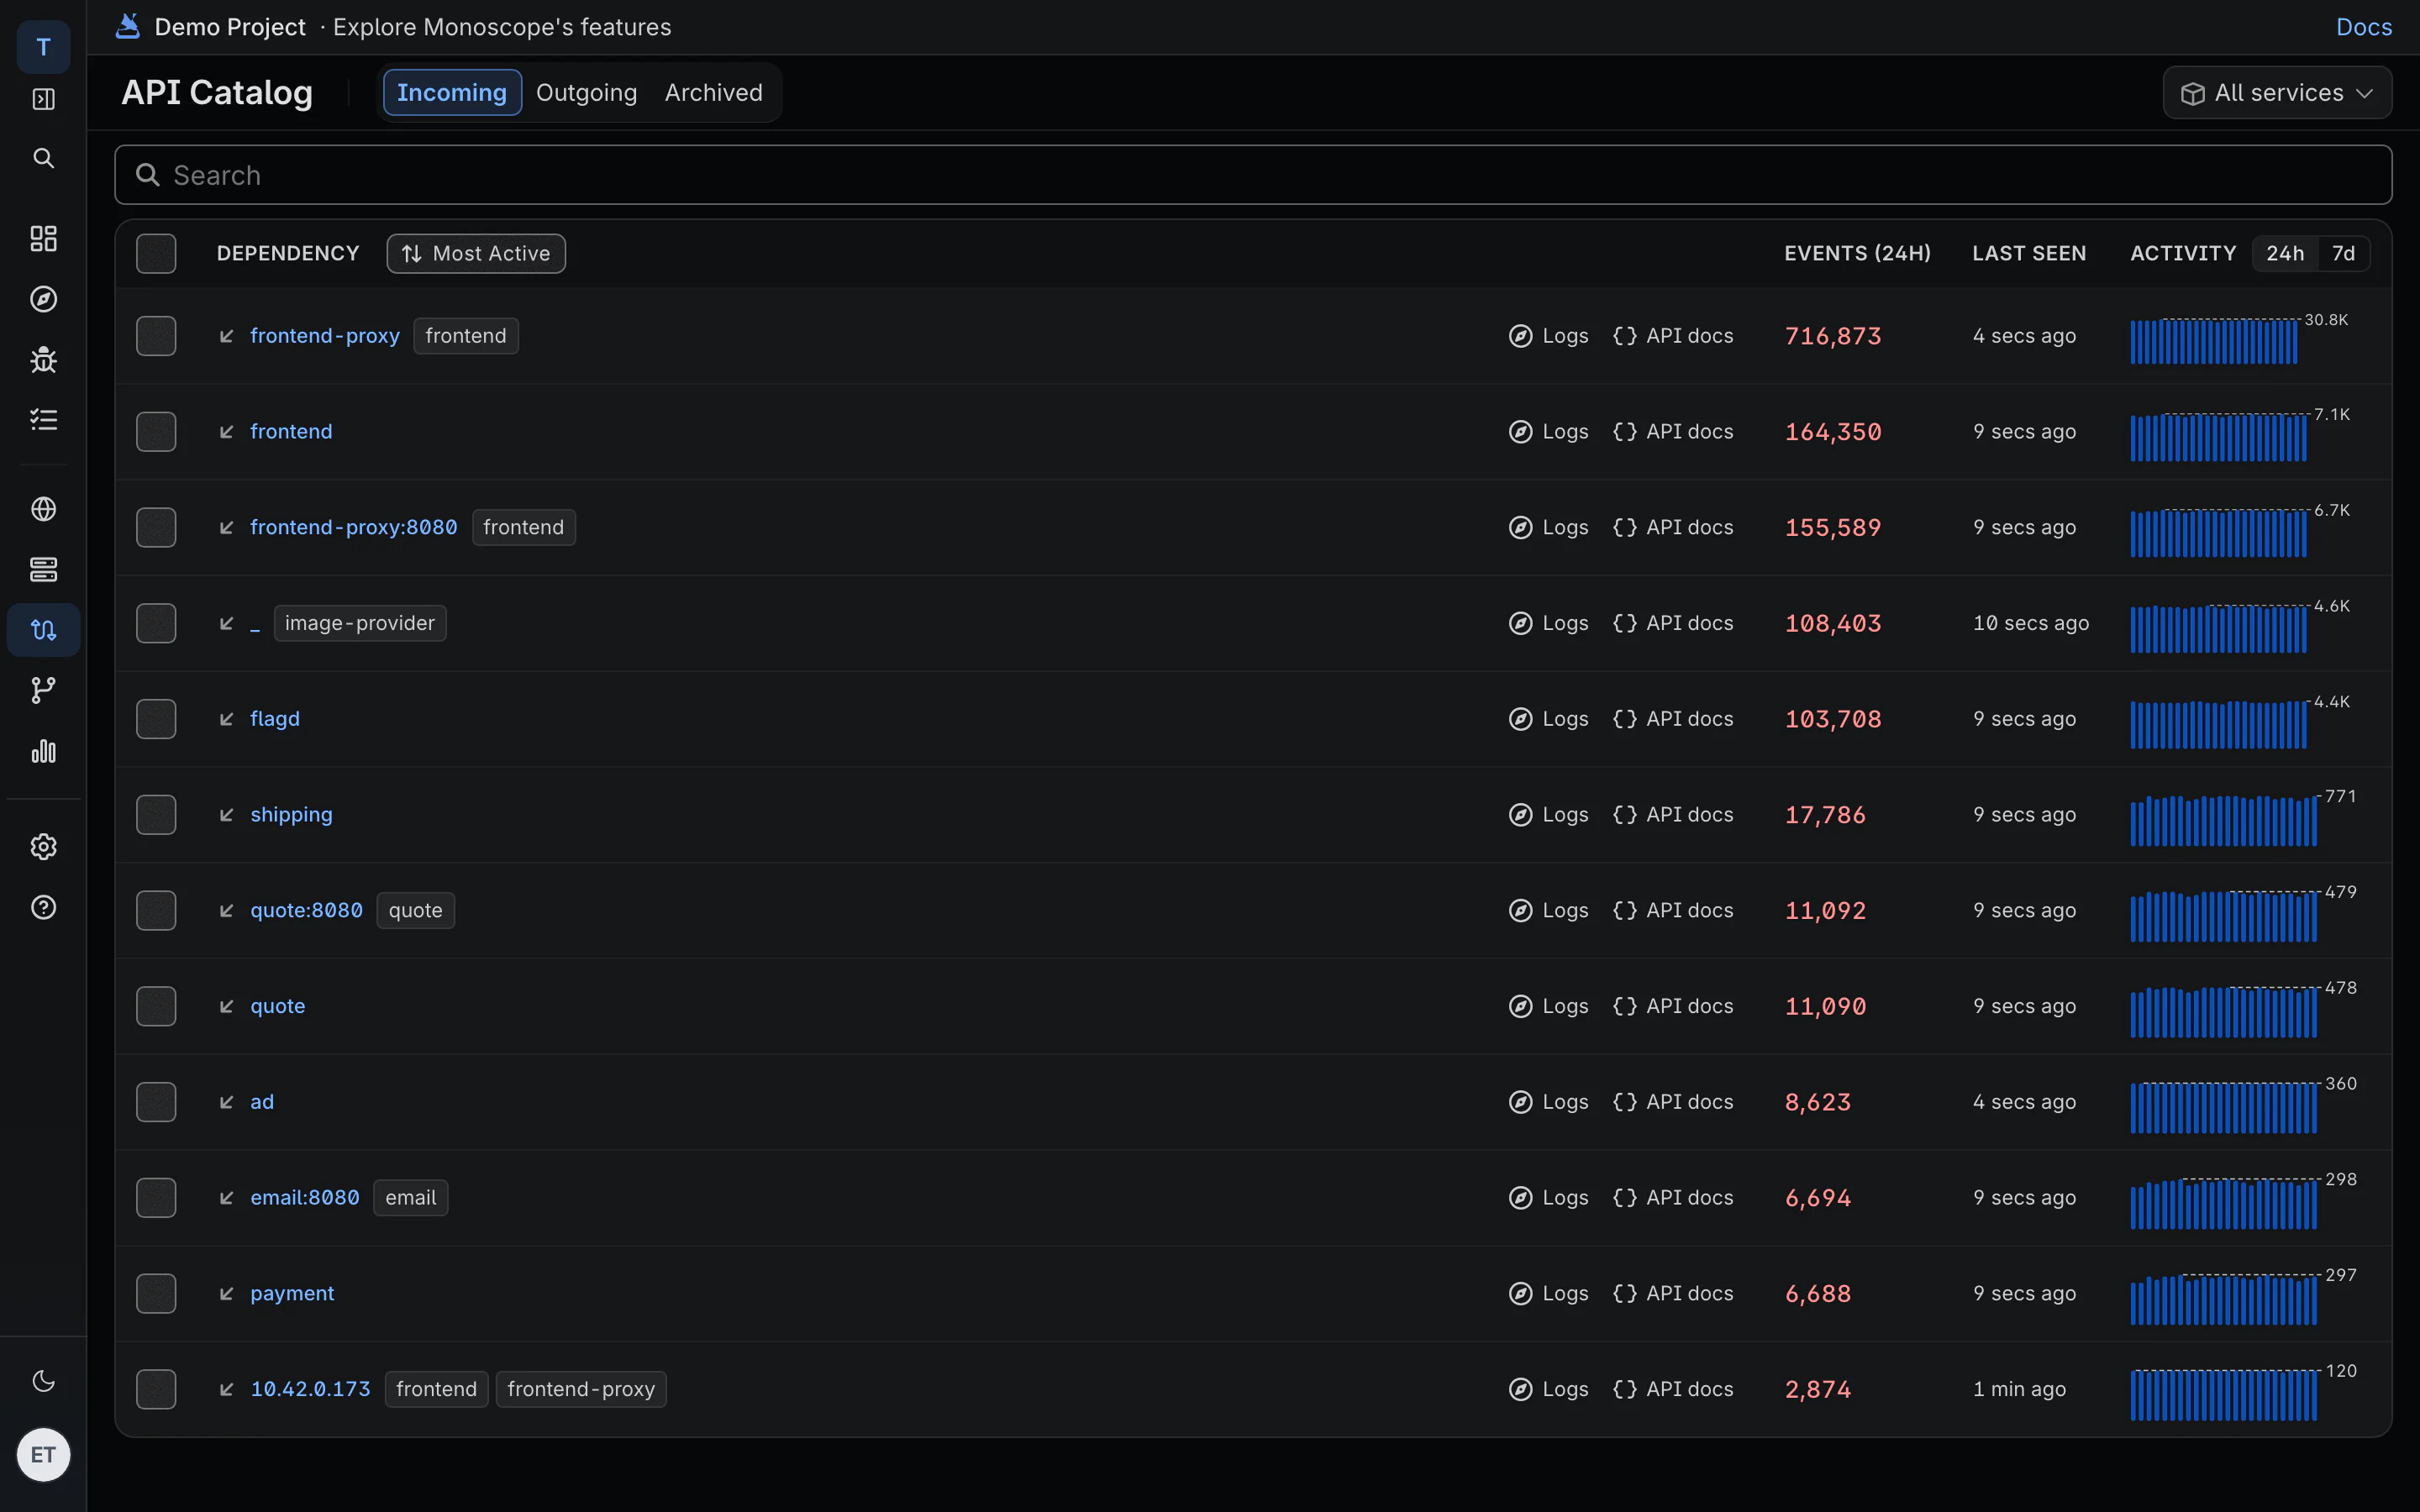
Breaking changes in the APIs you serve and the ones you call
Every call in and out, with bodies. When a supplier drops a field and still returns 200 OK, you get an issue with the requests that show it.
03 · Know · Metrics & dashboards
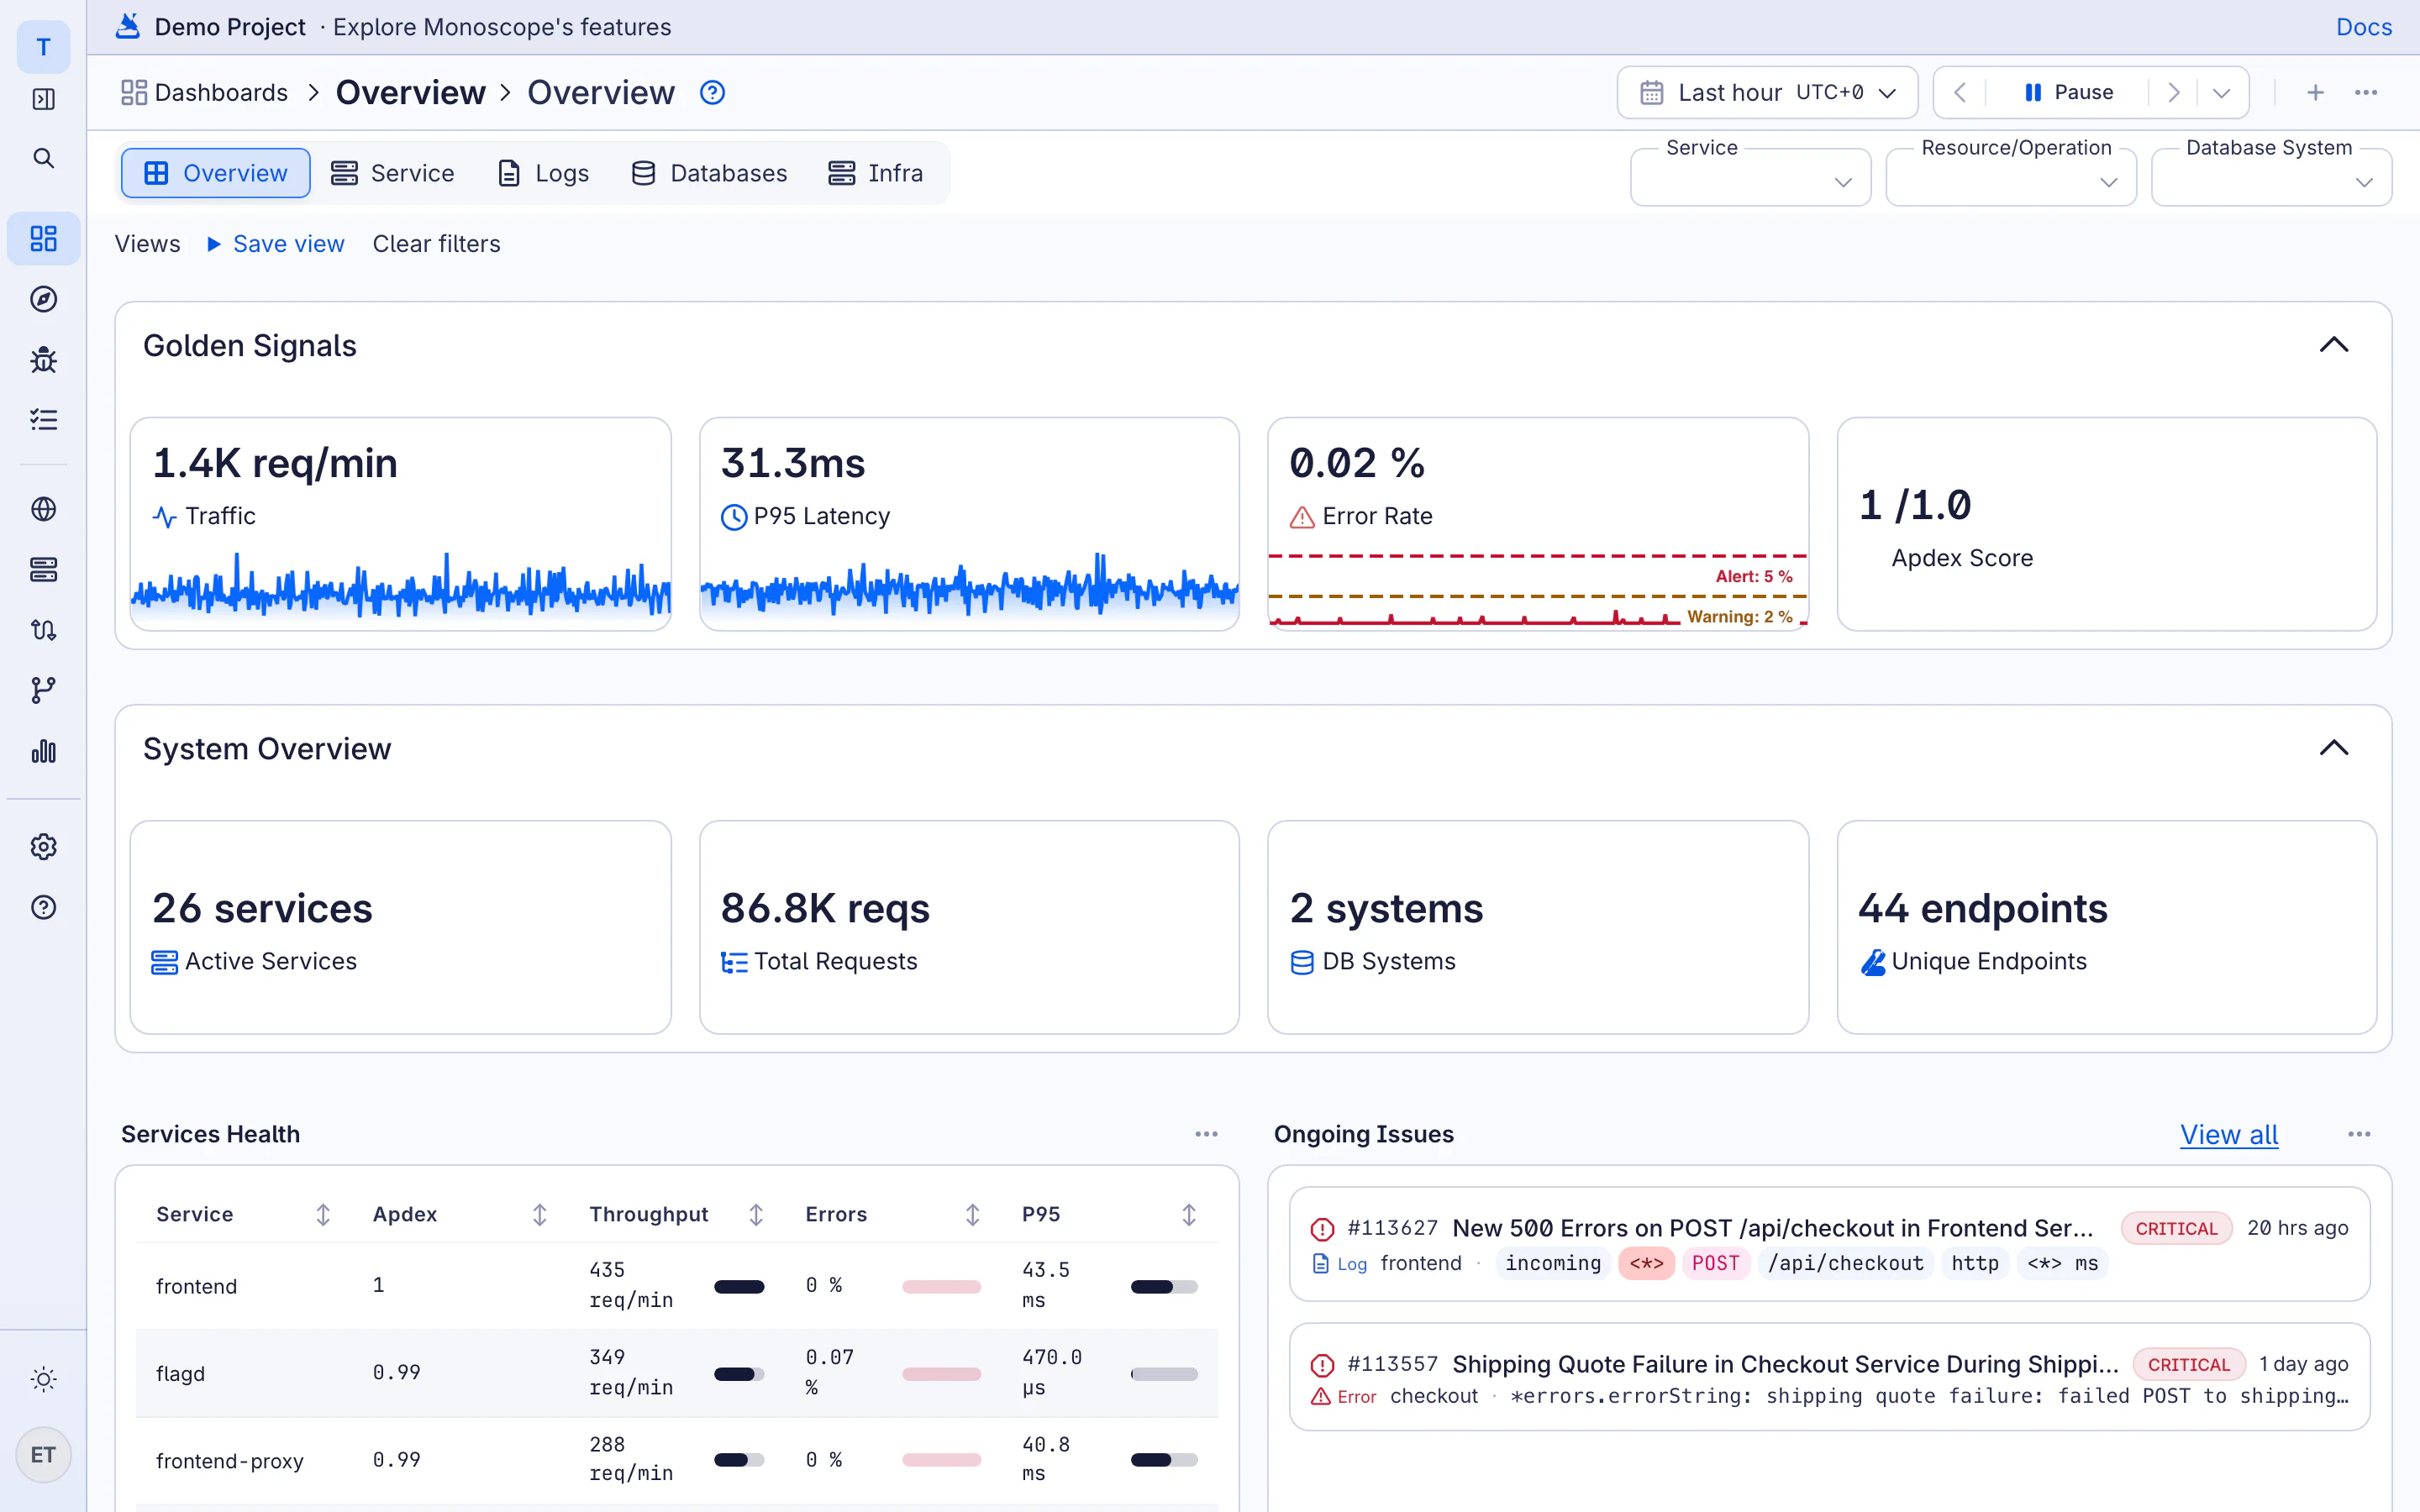
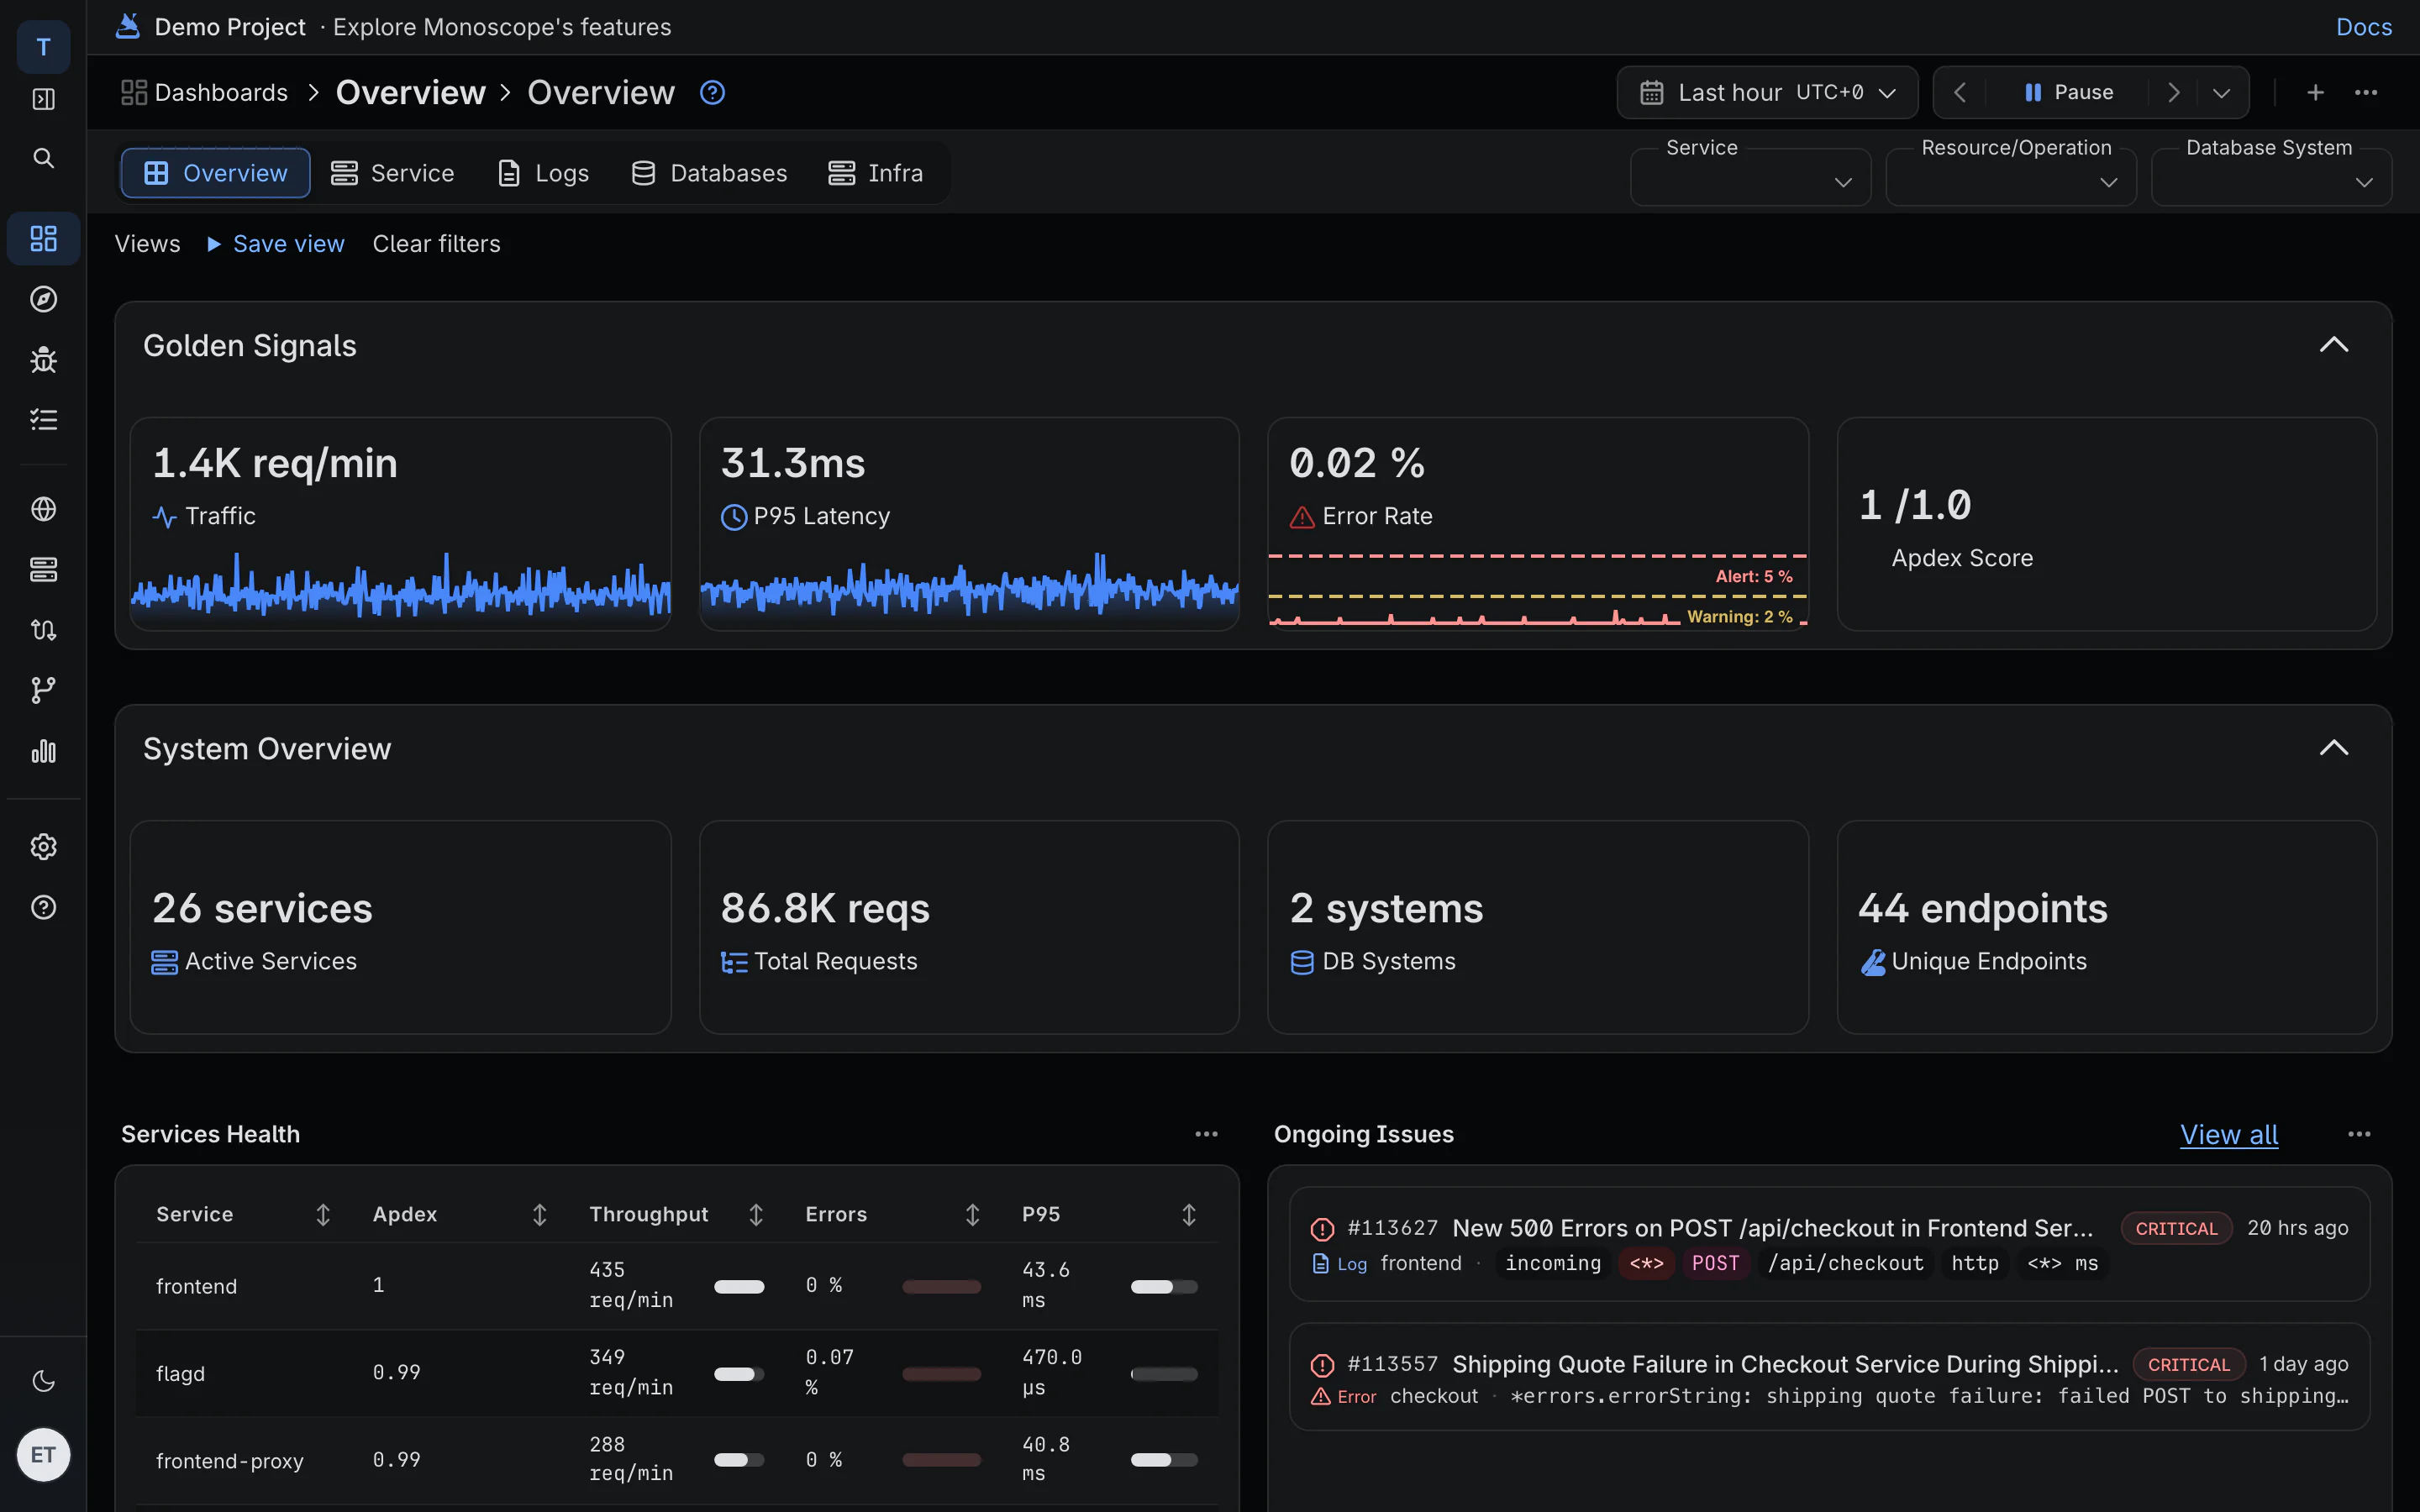
Dashboards and alerts on any query
Chart latency, traffic and errors from logs, traces and metrics, keep dashboards as code in your repository, and click from a spike to the requests behind it.
04 · Fix · AI SRE
An AI SRE that reads the actual request
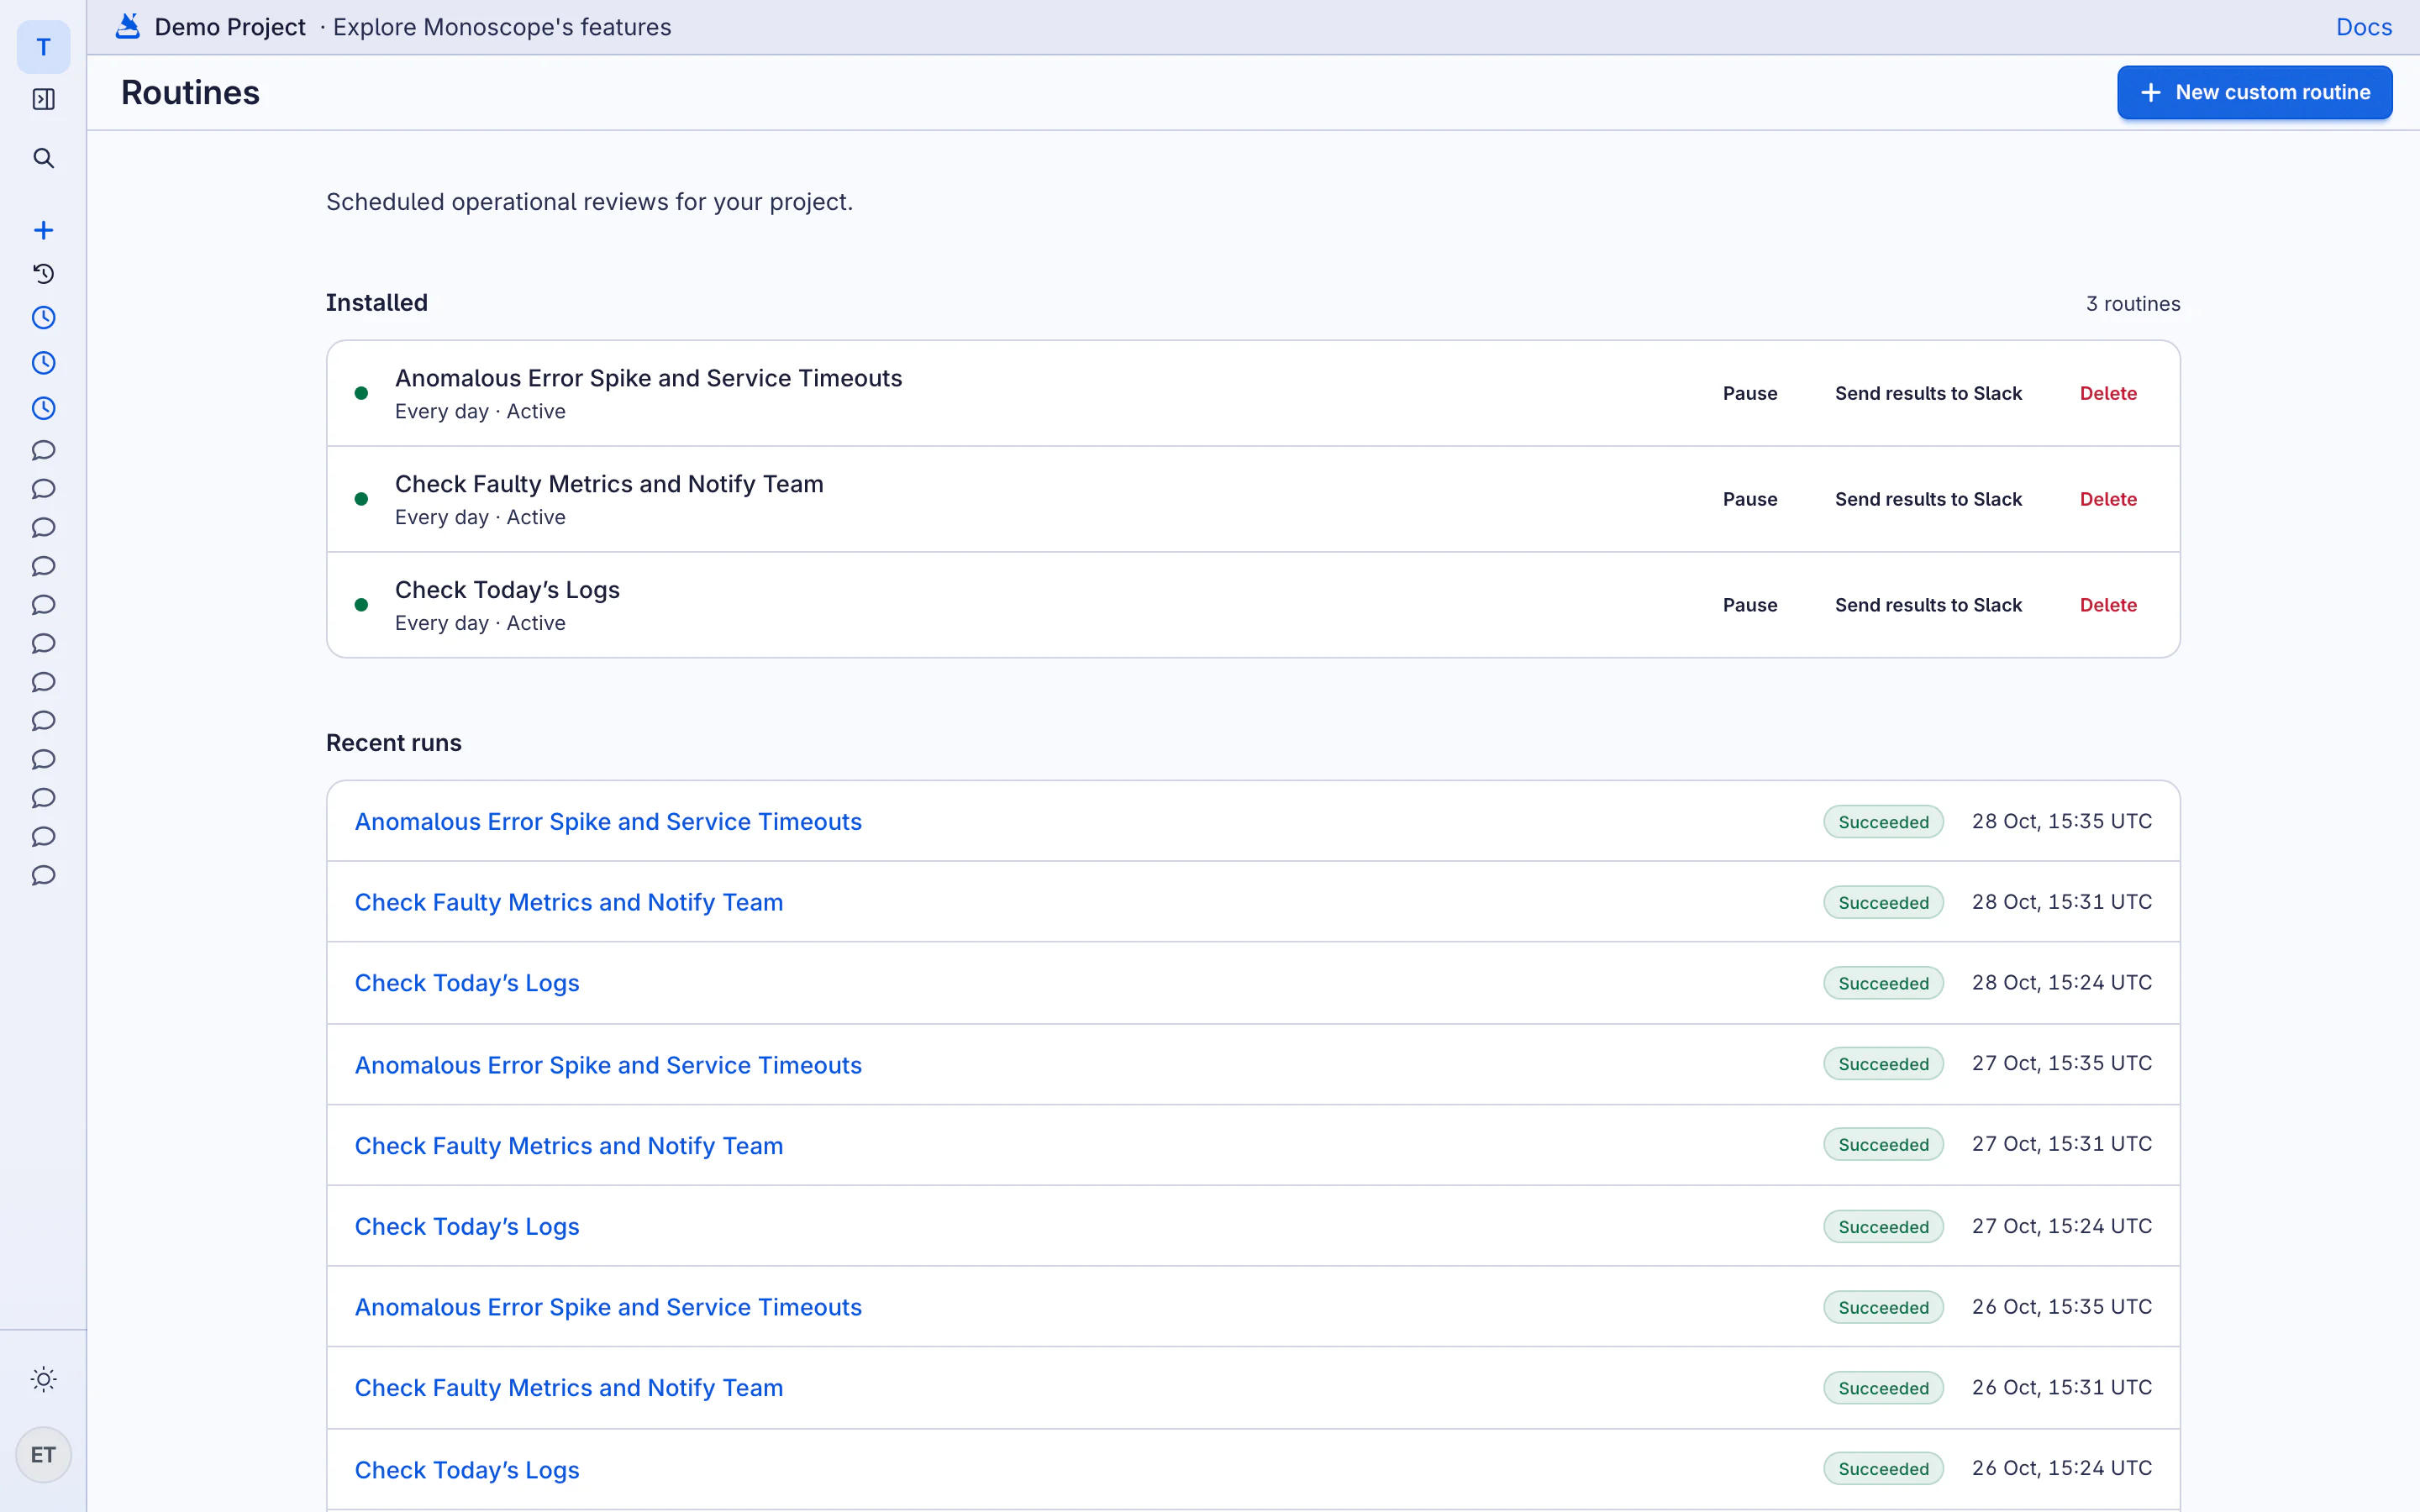
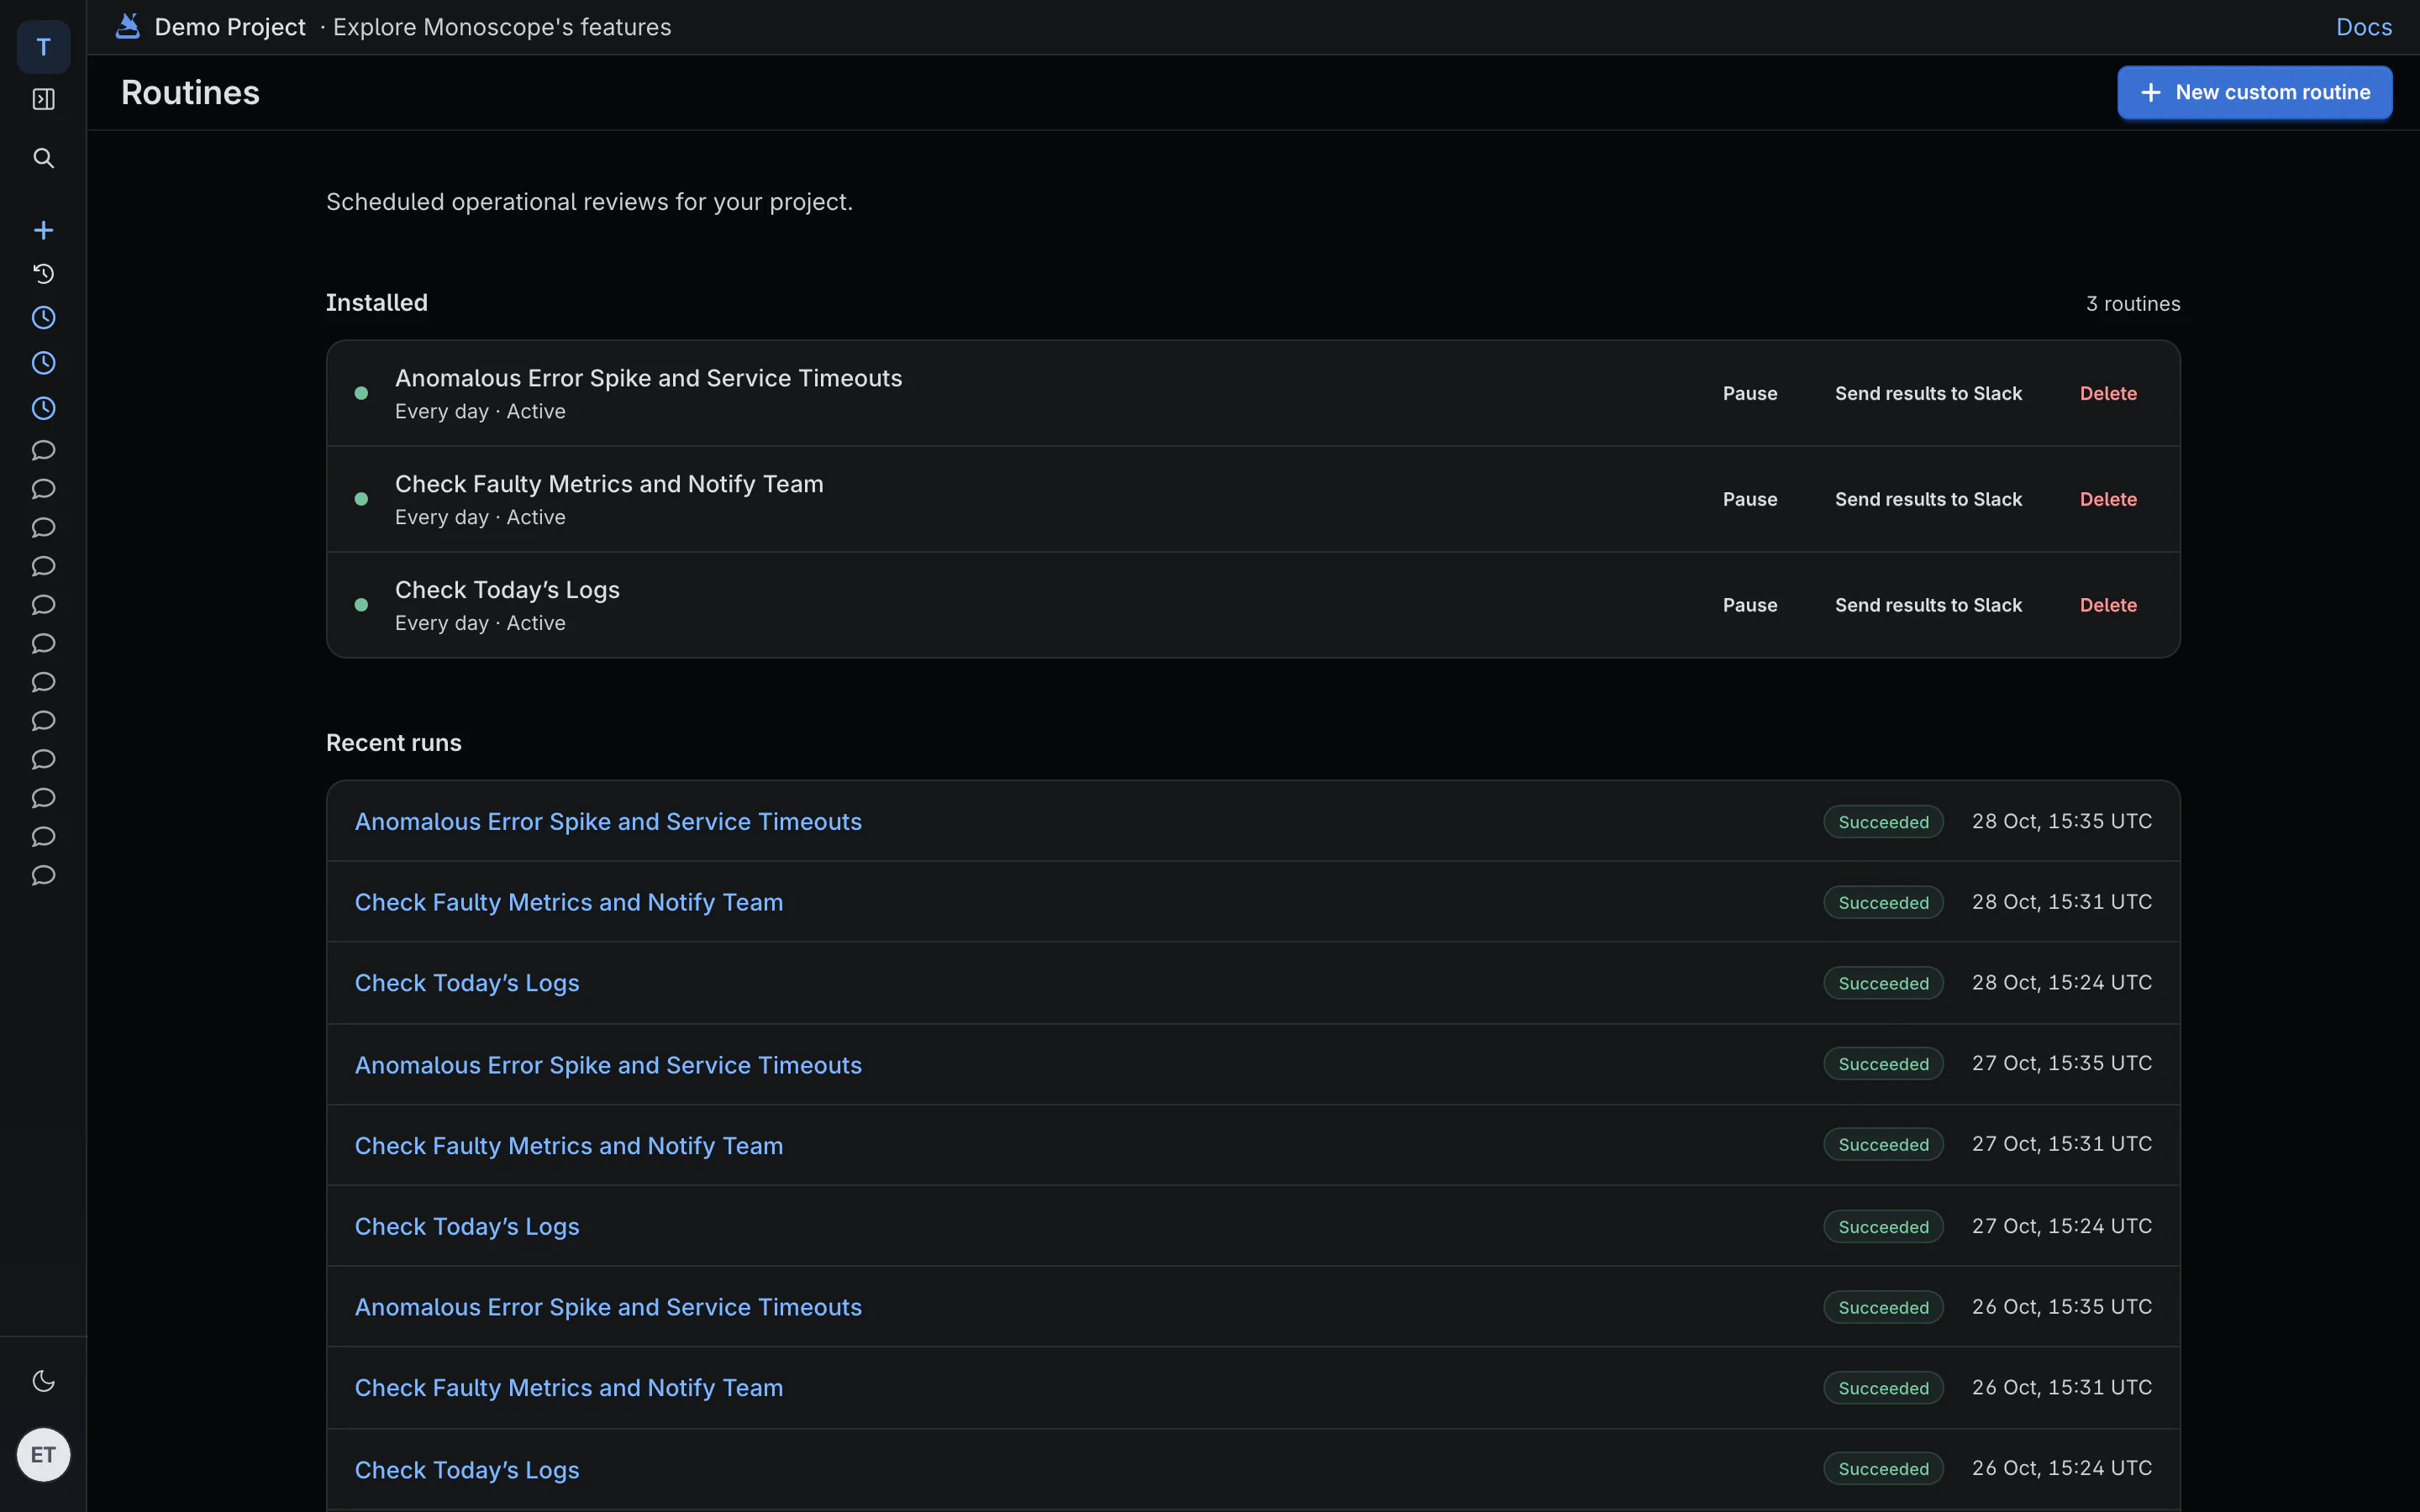
Routines check production on a schedule and post what they find. It answers questions in Slack, comments on pull requests with what production traffic says, and opens the fix, all from the unsampled request, not a sampled span.
05 · Prove · Logs & traces
Every log, span and request, with its body
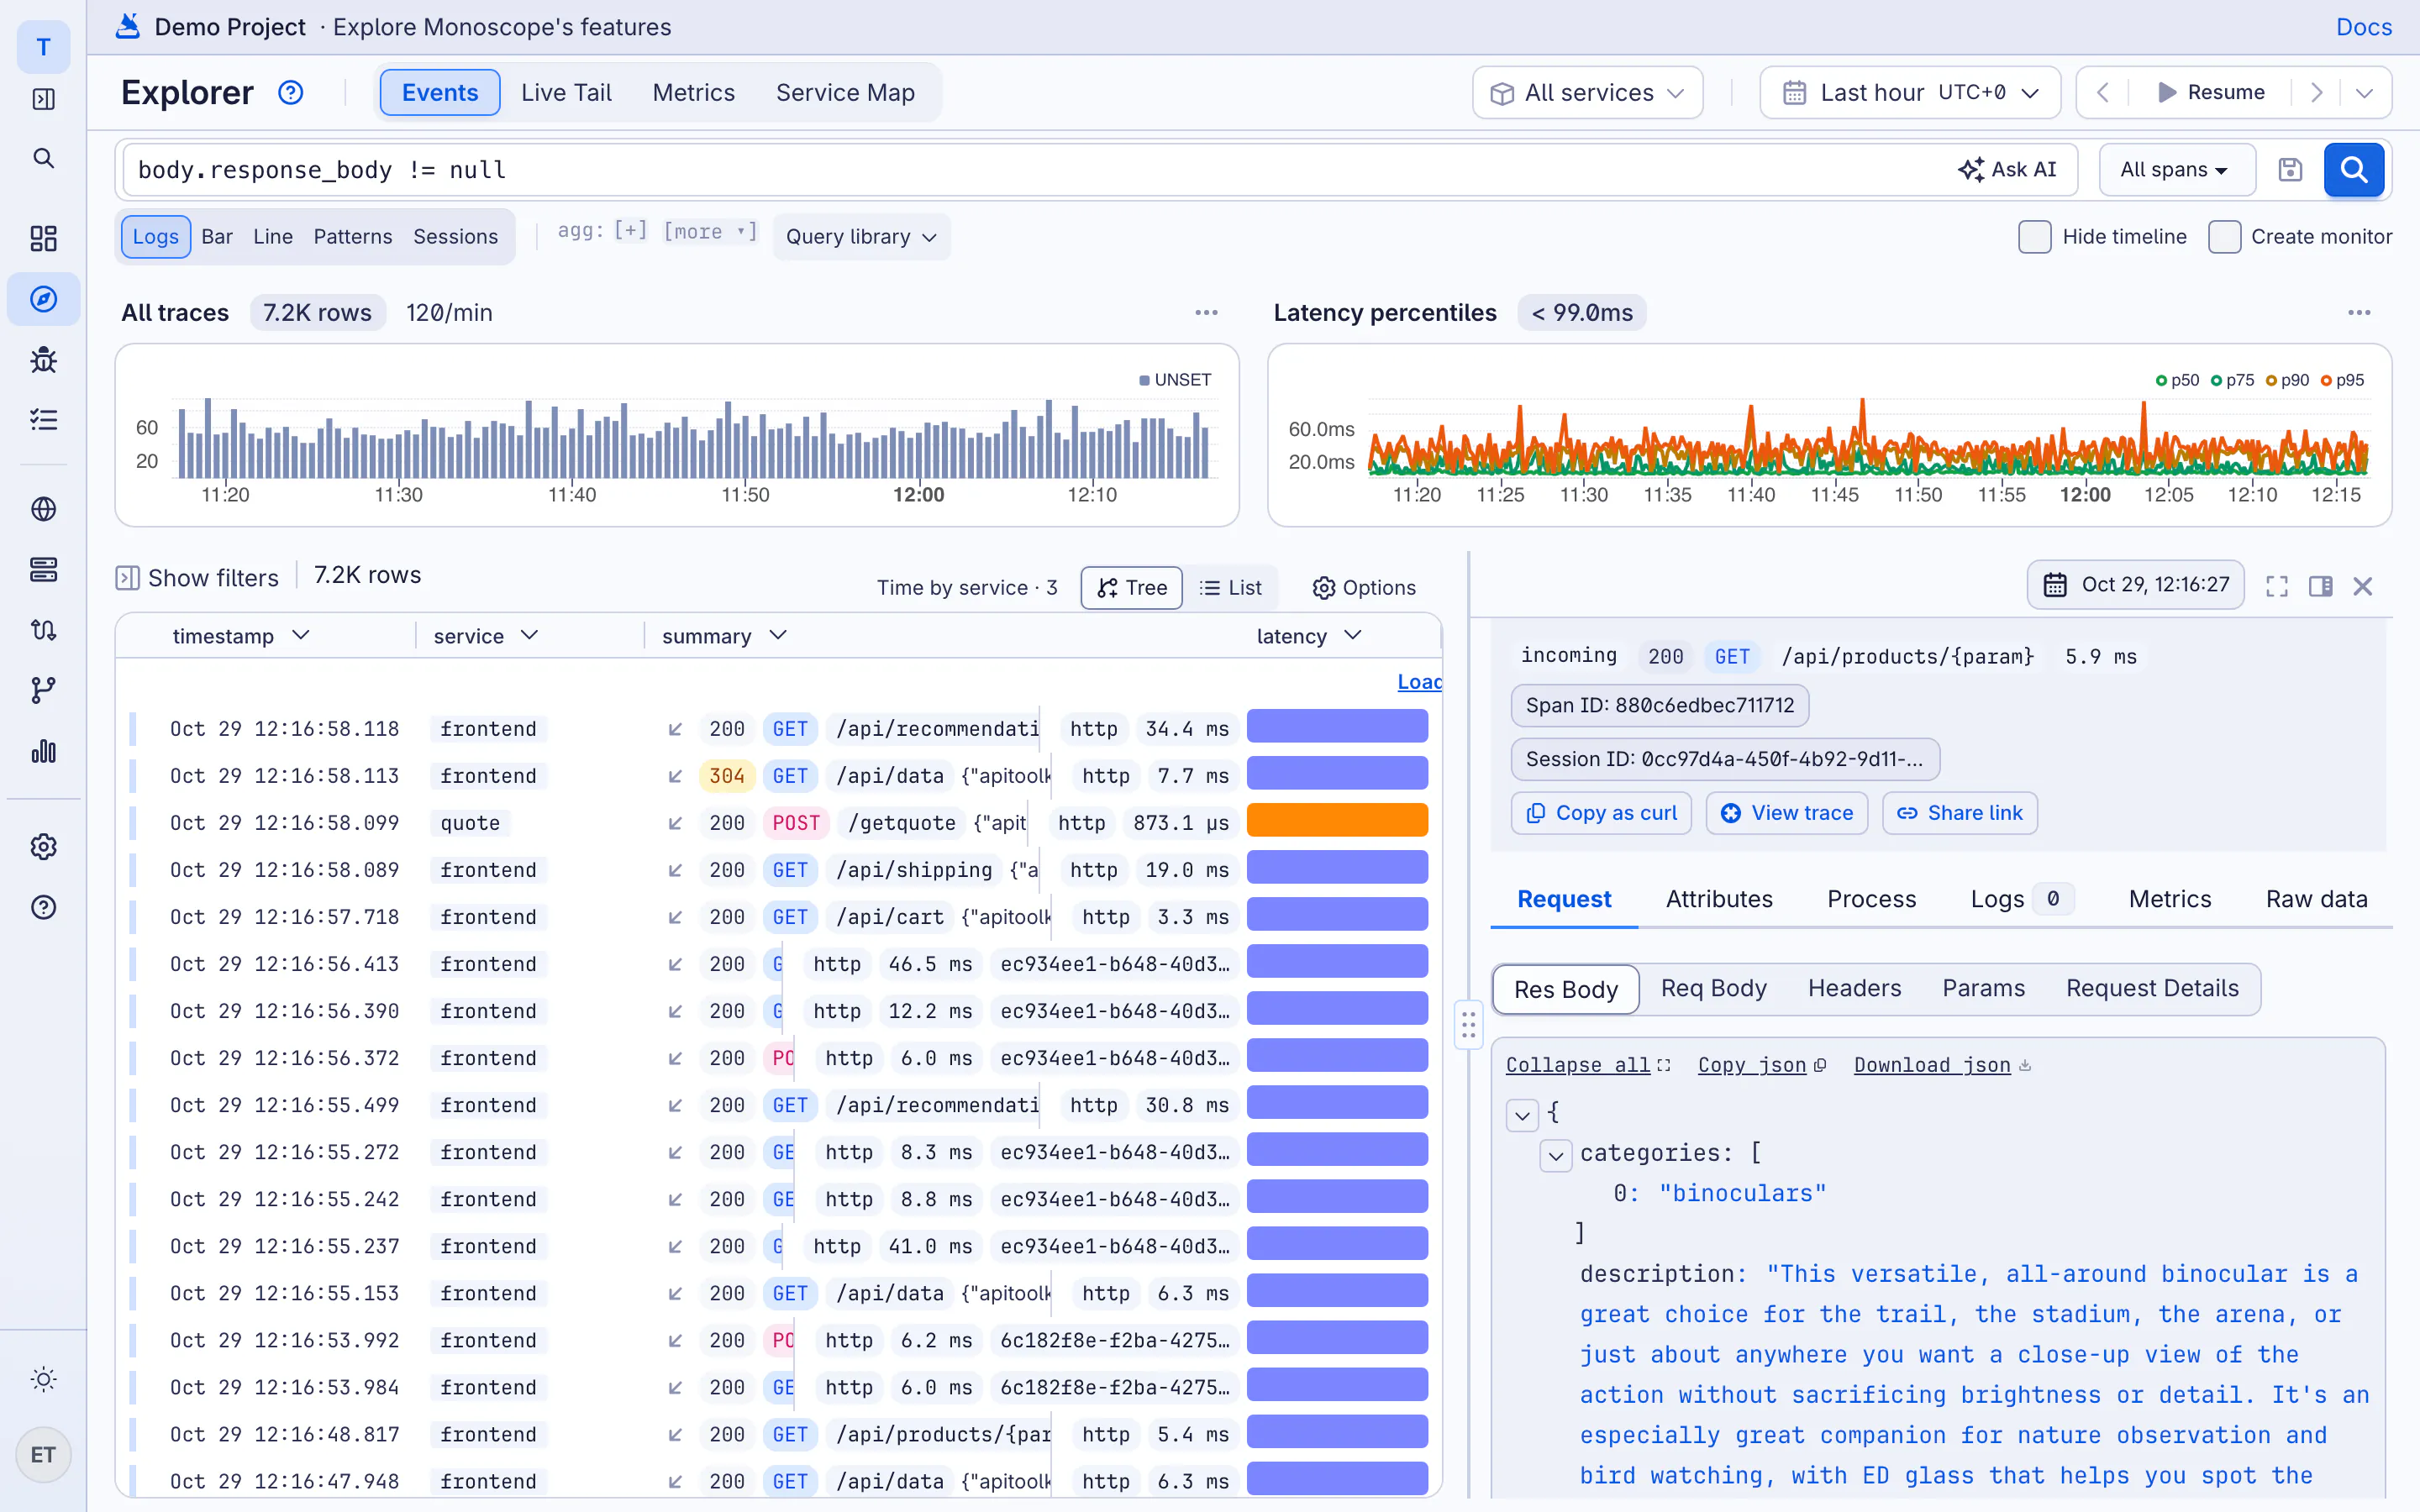
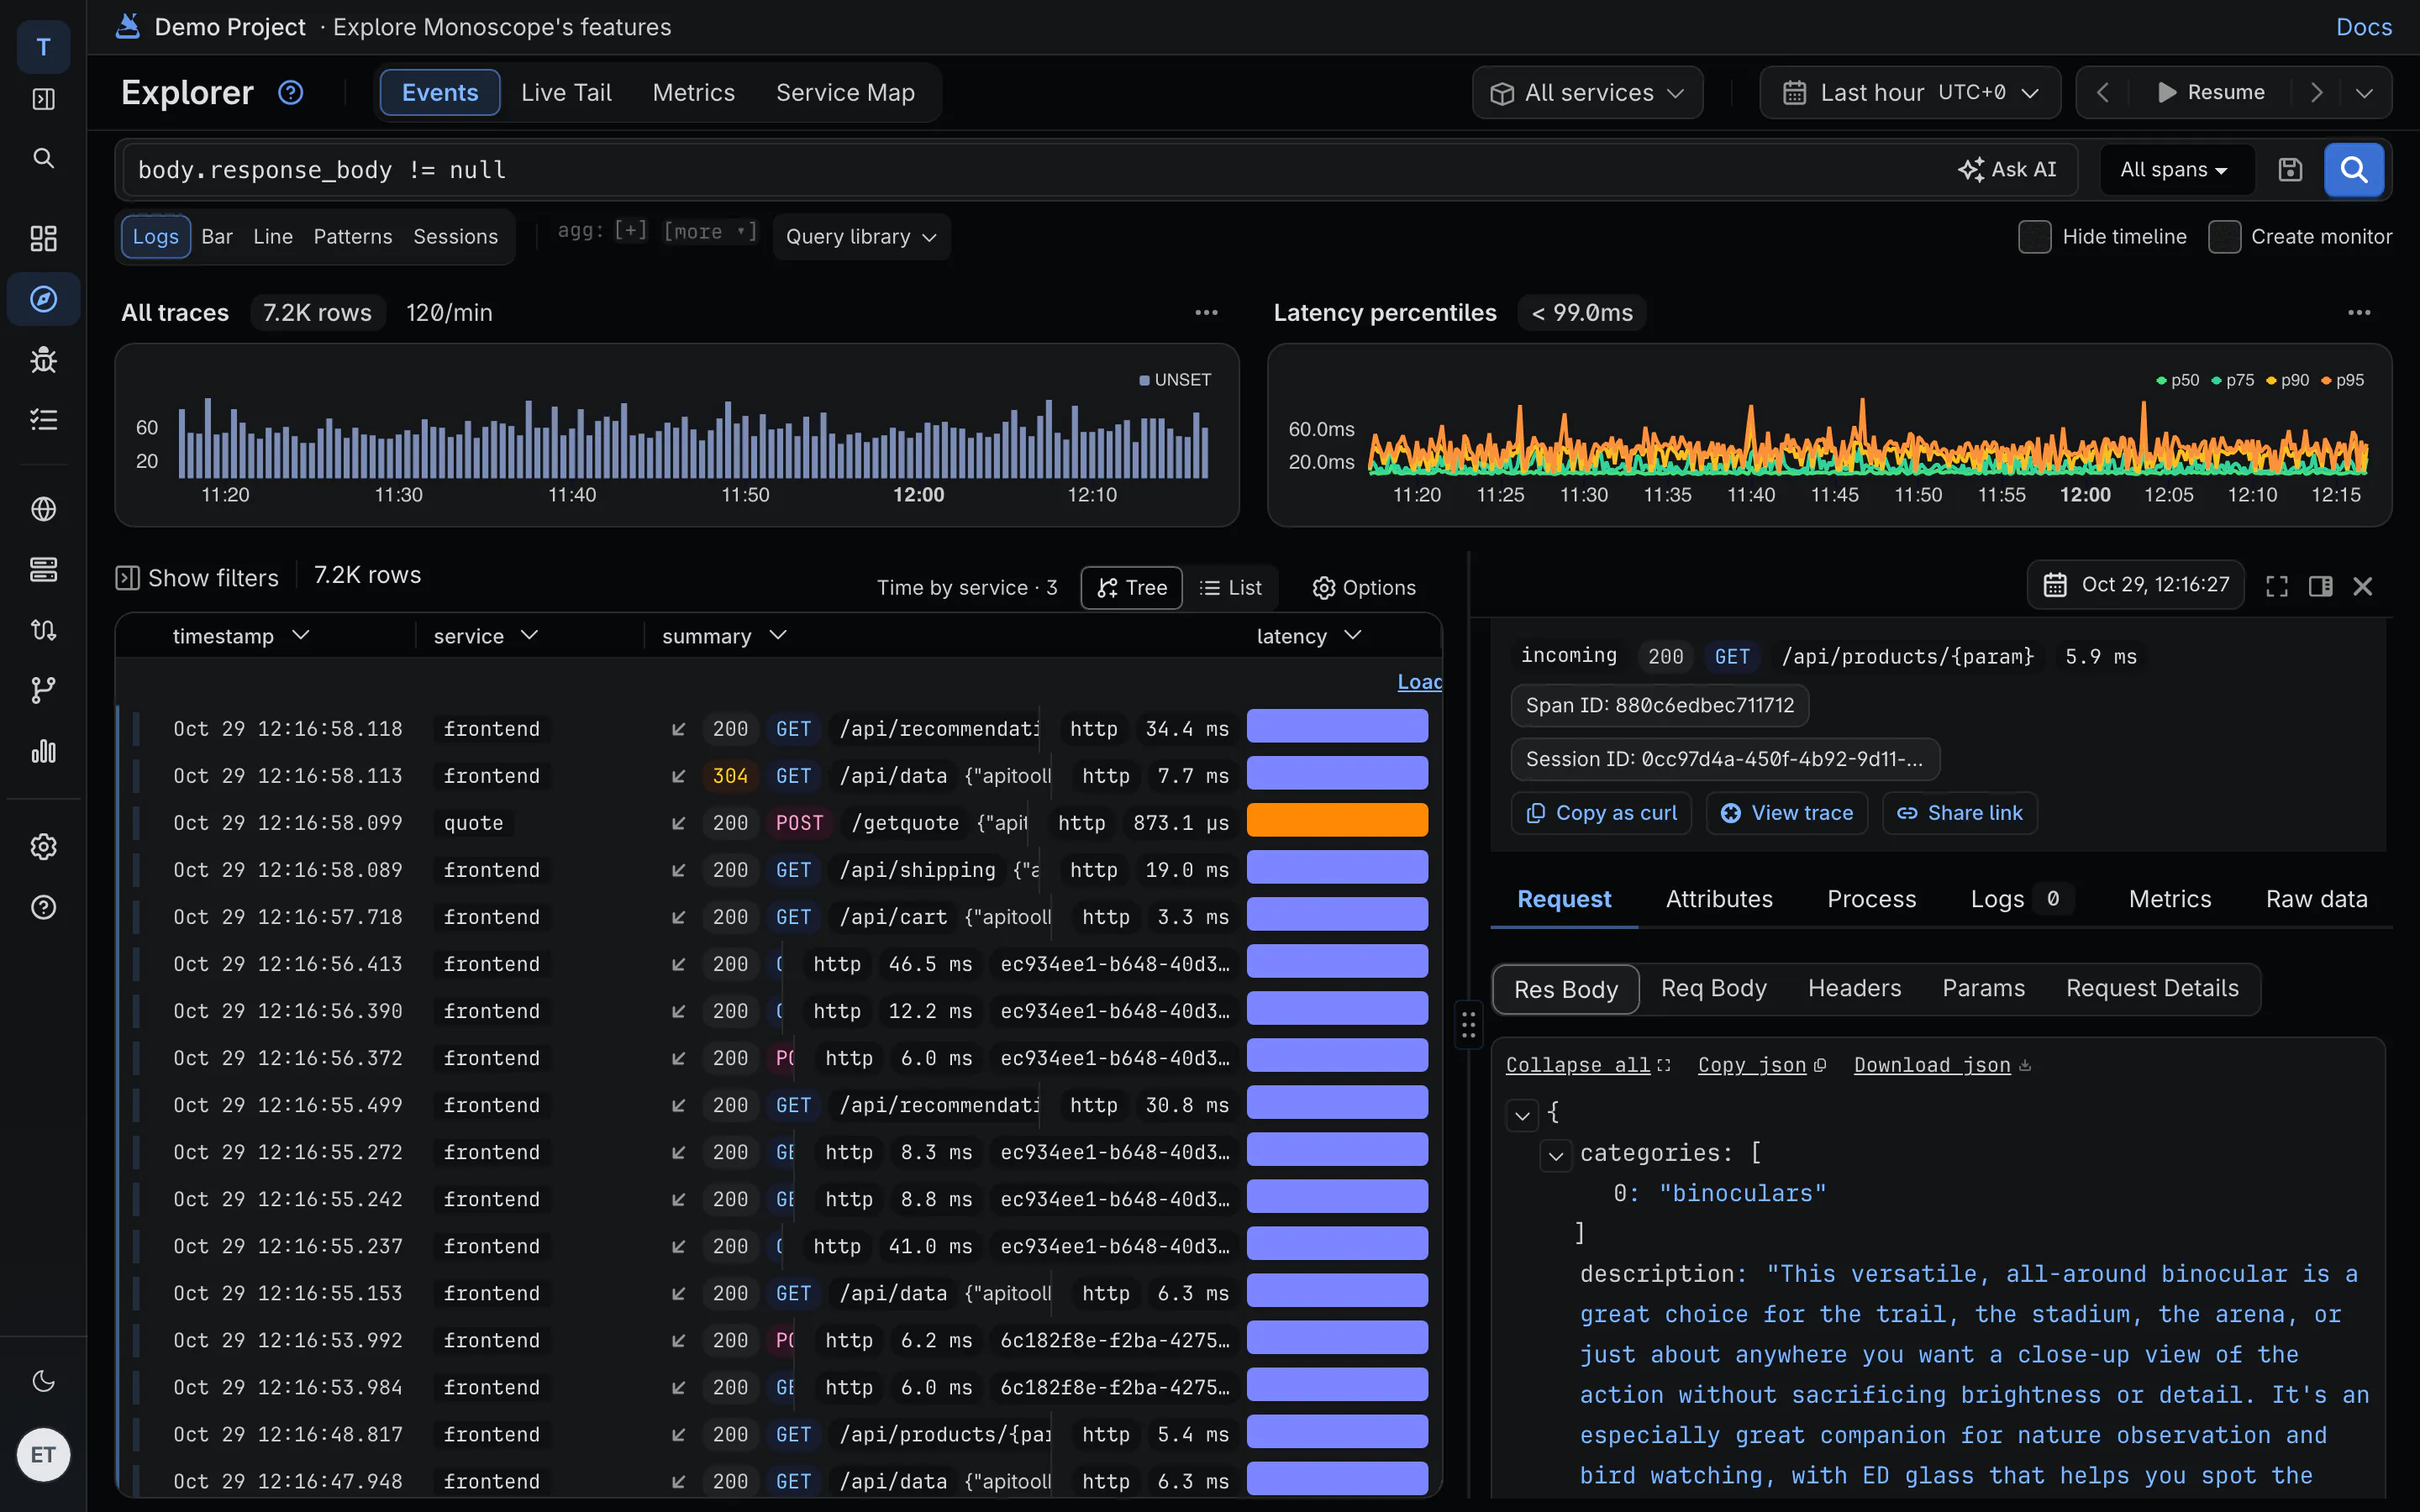
Search logs, traces and API calls in one explorer. Open any request to see what was sent and what came back, then the trace and the logs around it.
06 · Prove · Session replay
The customer's screen, and the request behind it
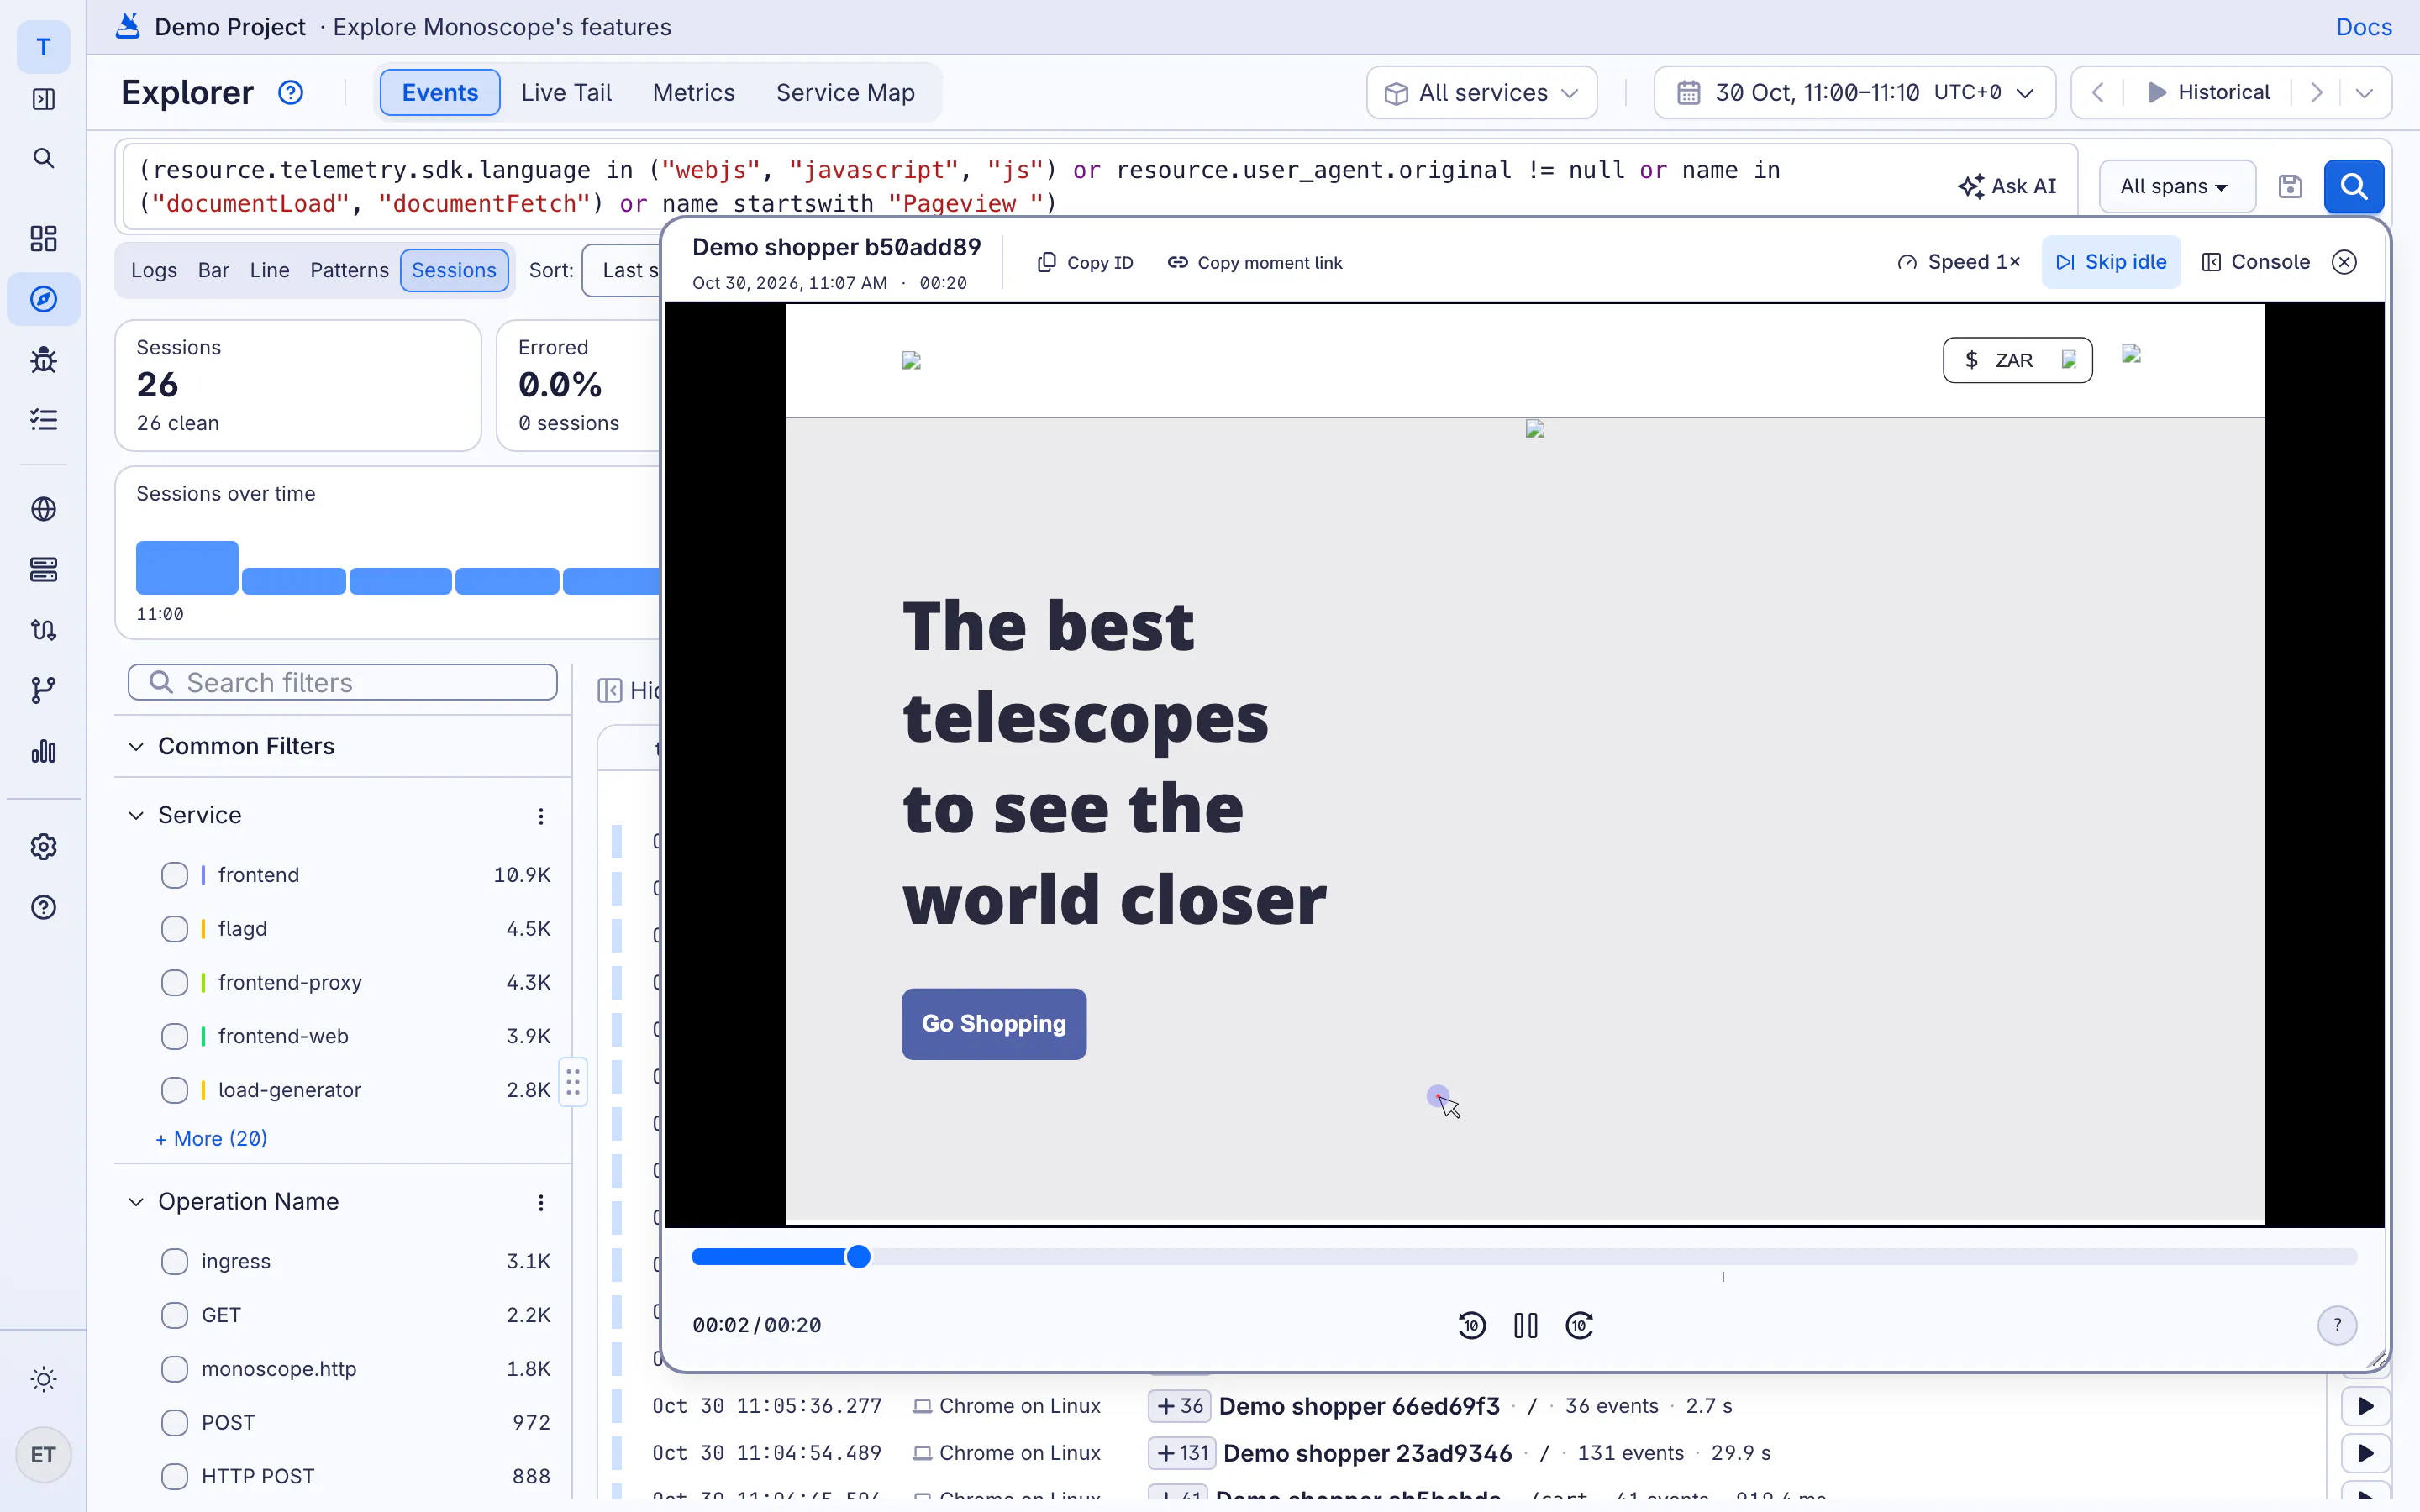
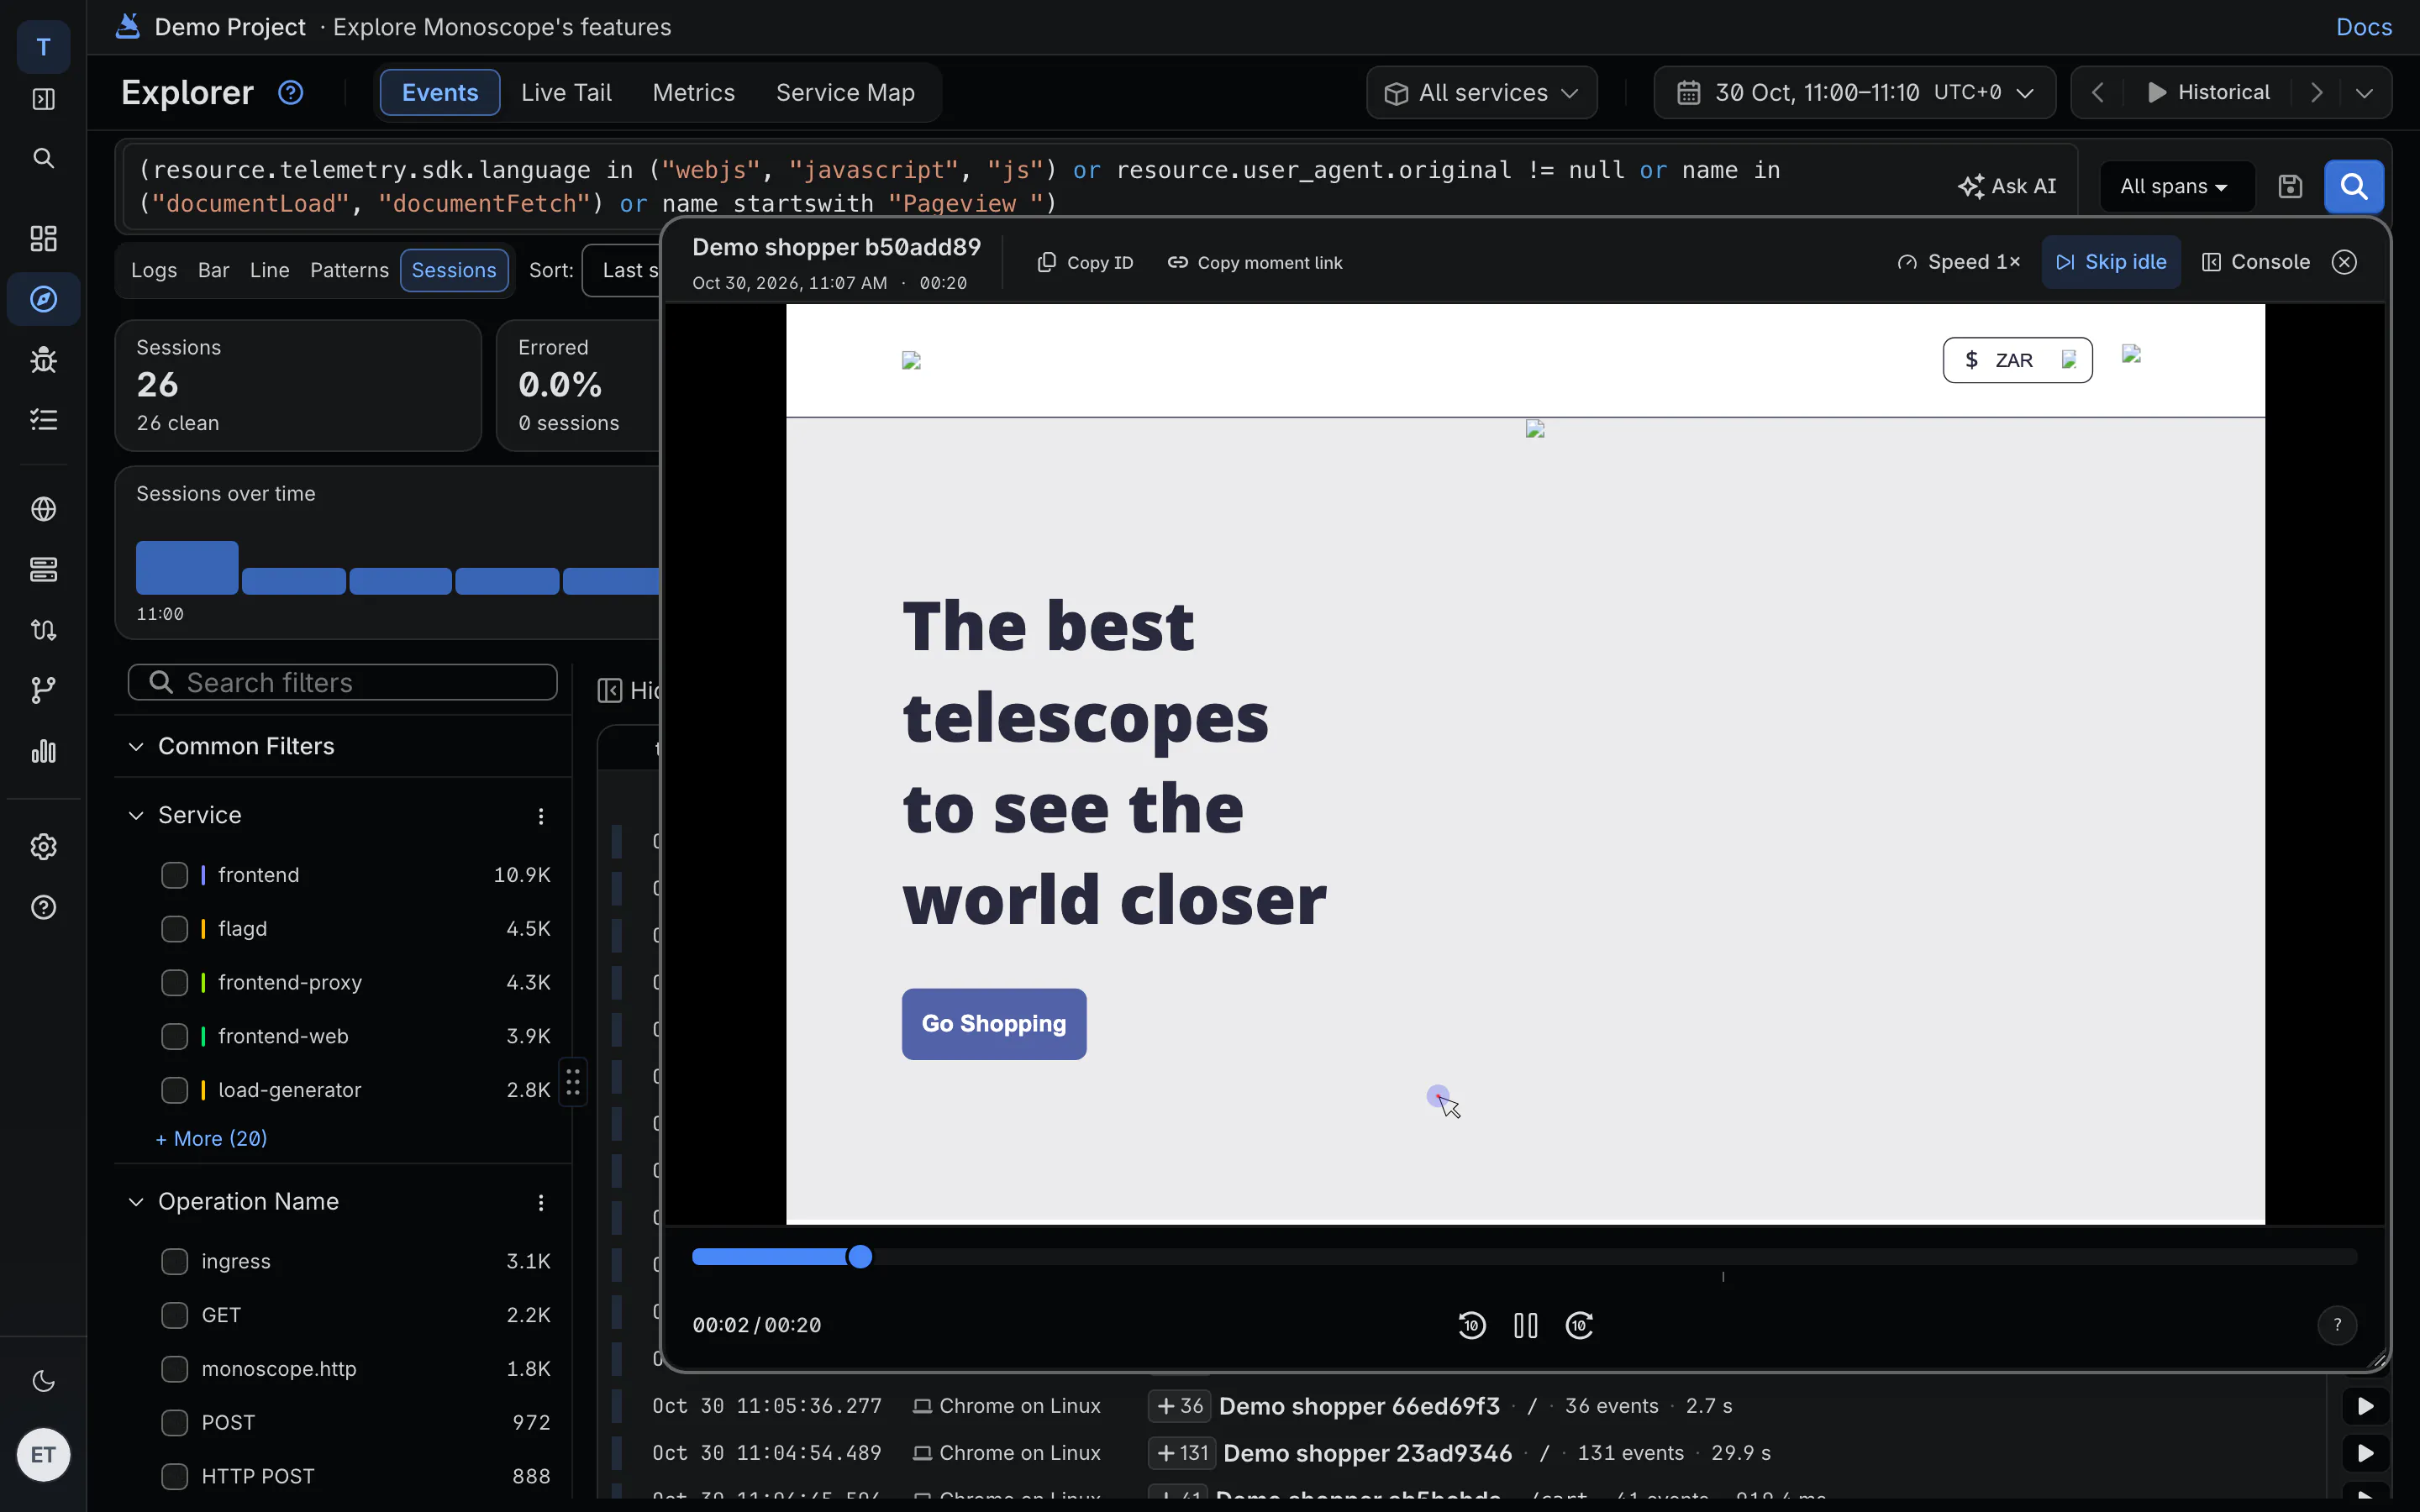
Replay the session at the moment it broke, with the error toast and the console, then jump to the backend request it fired.
07 · Prove · Your own bucket
Your S3 bucket is the database
Add your own bucket ($199/month) and every request, log, span, metric and replay is written there as open Delta Lake and Parquet. Unlimited retention, queryable from monoscope, DuckDB or any Postgres client.
duckdb · your data, from your bucket
INSTALL delta; LOAD delta;
SELECT count(*)
FROM delta_scan('s3://your-bucket/timefusion/otel_logs_and_spans')
WHERE project_id = 'your-project' AND date = DATE '2026-10-28';
Questions
Is monoscope an AI SRE or an observability tool?
Both, in one product. The observability side keeps the requests, logs, traces and metrics; the AI works from that record. There's no second vendor underneath deciding what it can see.
How much does it cost?
Free up to 10k events a day. Cloud is $29 a month for 20M events, then $1 per million. Request bodies don't add to the price.
Where is my data stored?
On monoscope Cloud in the US or the EU, in your own S3 bucket, or on your own servers with the open-source edition (AGPL 3.0).
Are you SOC 2 certified?
Not yet. We sign DPAs, host in the EU, redact in the SDK before data leaves your app, and the code that handles your data is open source.
Do I need to replace my current tools first?
No. Point an OpenTelemetry exporter at monoscope, run it next to Datadog or Sentry for a week or two, and compare what each one catches.