Logs & Traces
- Log patterns. Similar log lines are grouped into patterns, each with a count and a trend chart.
- JSON logs. JSON bodies display properly: values are highlighted in the summary, the message field is pulled out, and log details have a Body tab. ANSI color codes are stripped.
- Span errors. A redesigned error card shows the stack trace. Duration, kind, service, span ID and trace ID badges filter on click.
- Time picker. More presets, from 5 minutes to 3 days. The default range is the last hour instead of 24 hours, and the chart marks the range shown in the list.
- Child spans and logs no longer appear detached from their trace or twice.
-
Breaking. The HTTP span name changed from
apitoolkit-http-spantomonoscope.http. Update saved queries and filters that use the old name.
Dashboards & Metrics
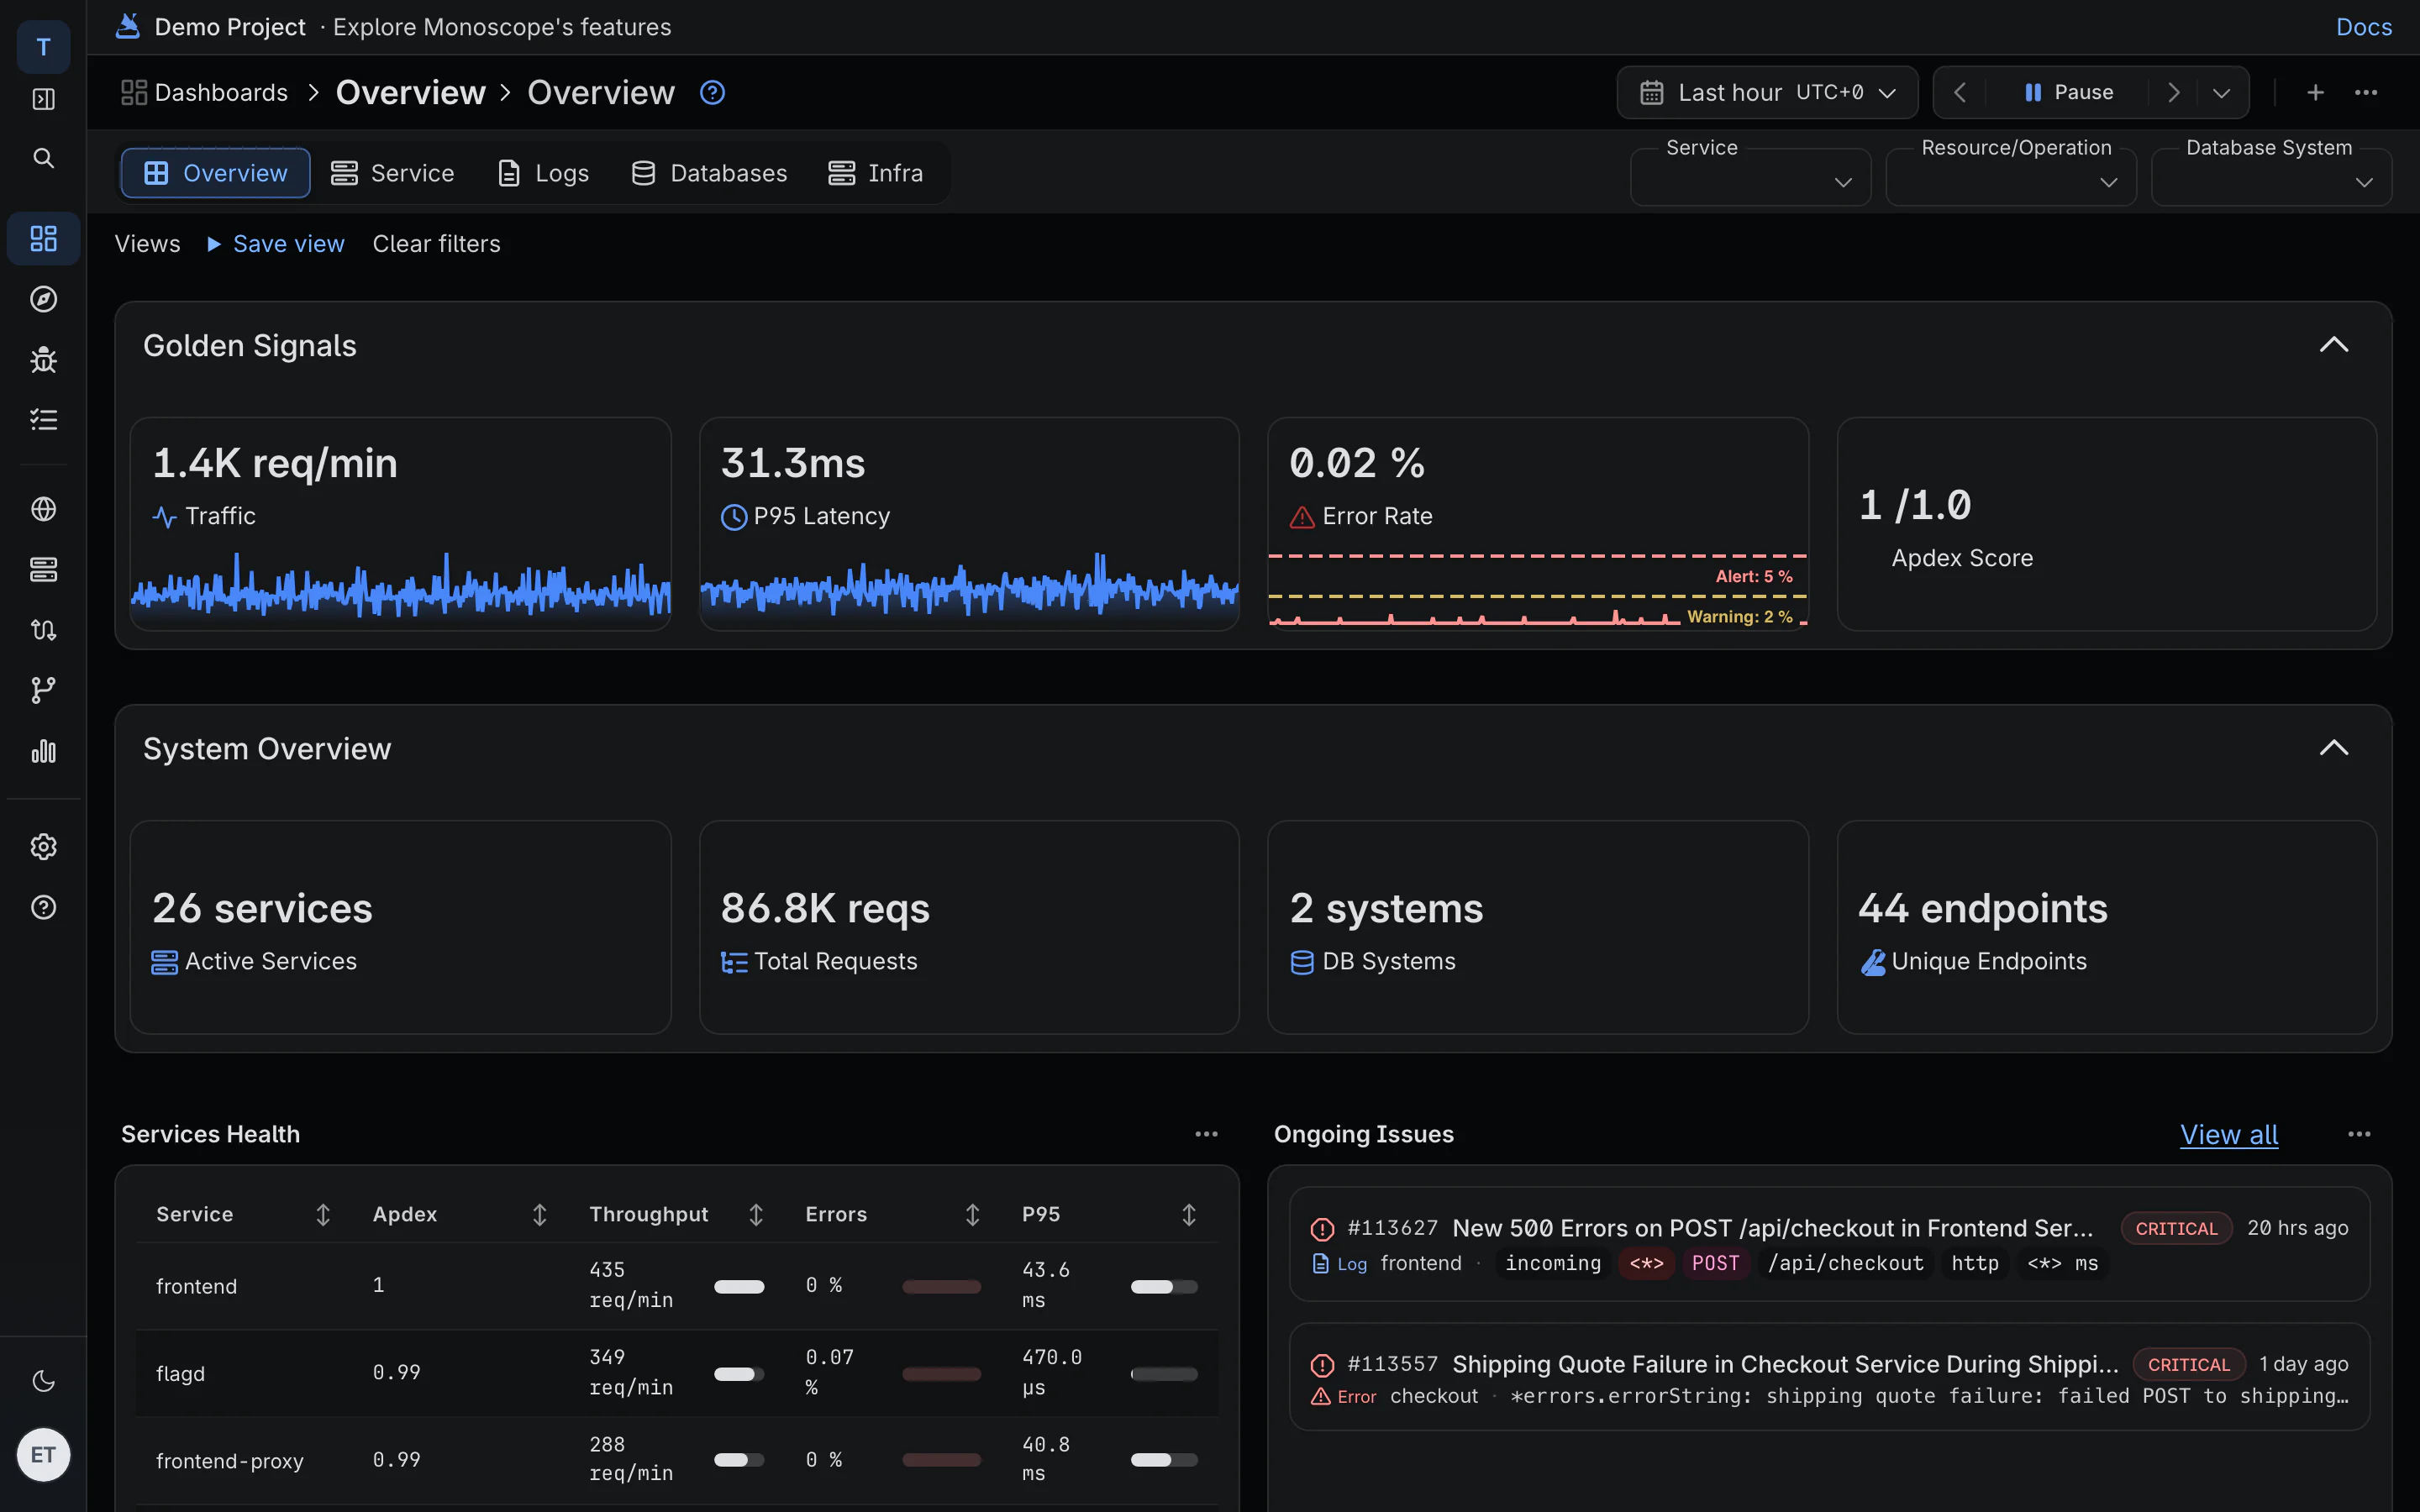
- Overview dashboard. Tabs for Overview, Service Summary, Resources, Traces, Logs and Databases. See request volume, error rate, p95 latency, top operations and recent traces, filtered by service.
- The ongoing issues widget was improved.
Monitors & Alerts
- Edit an existing alert from the explorer.
AI SRE
- Questions to the Slack, Discord and WhatsApp bots understand time ranges like “last 3 hours”.
Issues
- Numbers and variable data are stripped from error messages before grouping, so repeats of one error land in one issue.
Performance
- The explorer re-renders less, jumps less, loads tooltips lazily, caches summaries and downloads smaller assets.
- The projects list loads faster.
Onboarding & Billing
- Plan names in the app match the website, and old APItoolkit links in the app, emails and bots point to monoscope.tech.
Self-Hosting
- Basic auth. Sign in to a self-hosted install without an external identity provider. In-app monitoring and third-party scripts can be turned off with environment variables.
- The project is now named monoscope, and the Docker image builds from one multi-stage Dockerfile.