Logs & Traces
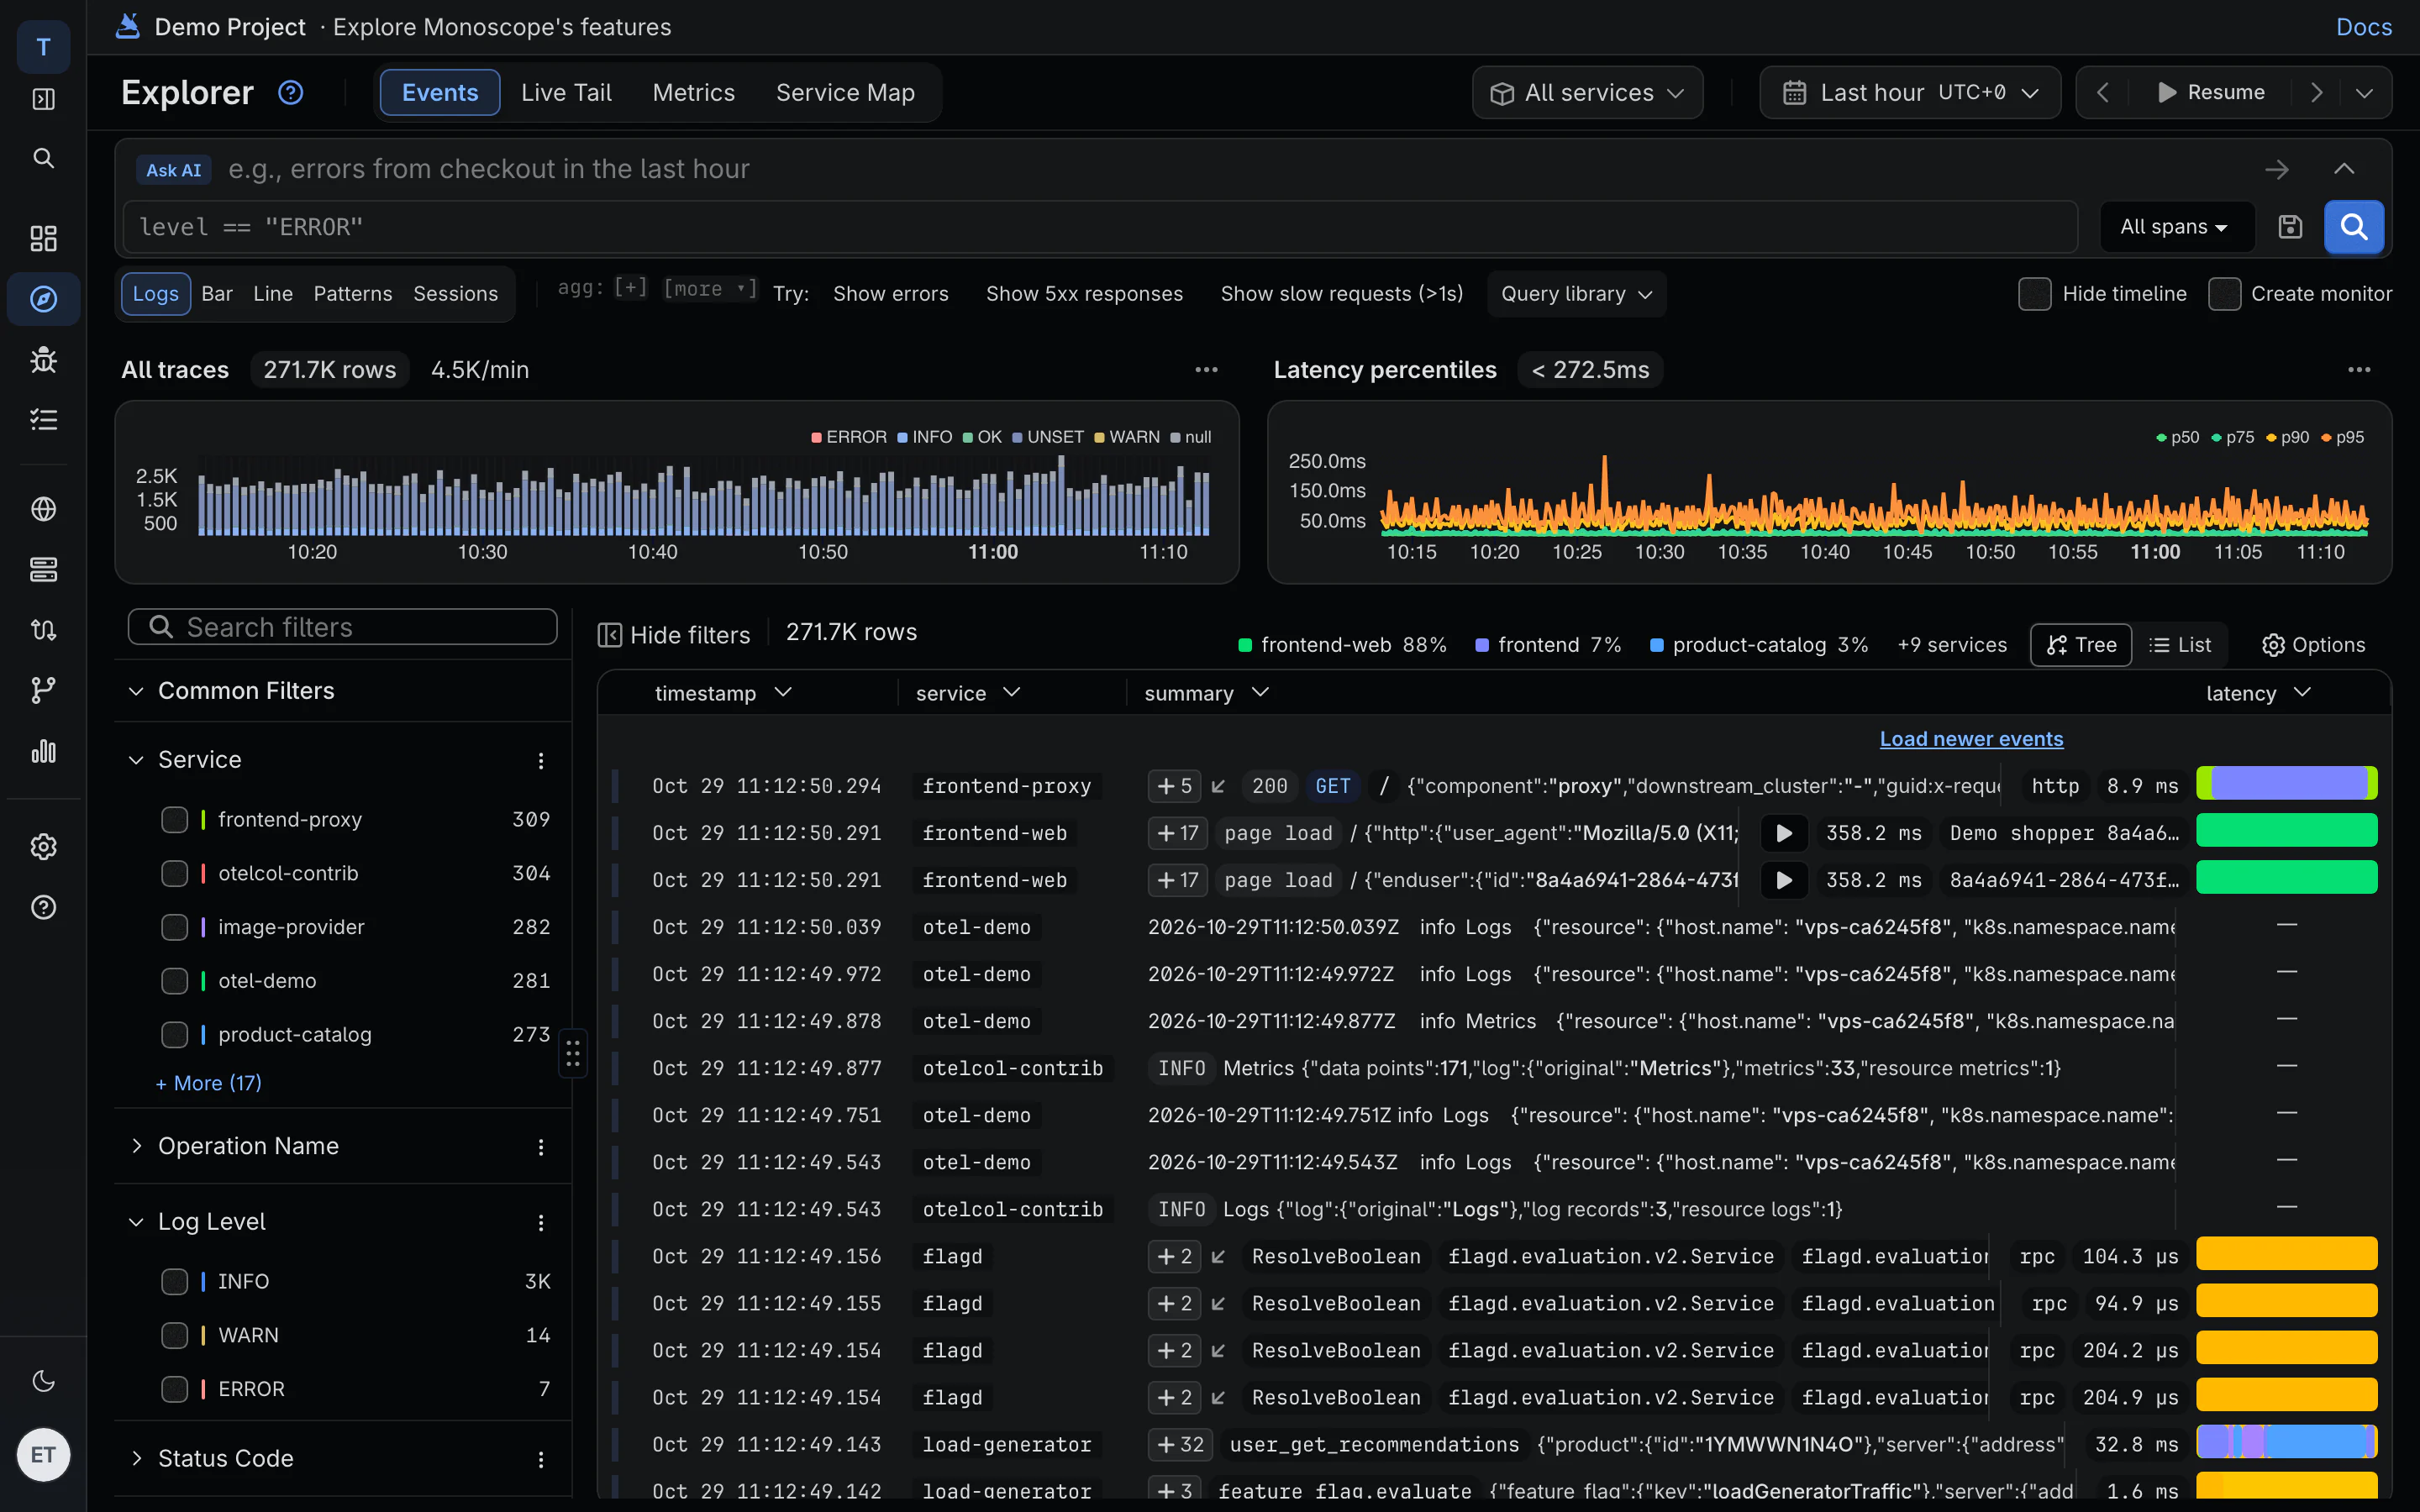
- One explorer. Logs and spans now come from one OpenTelemetry store and show in one stream. The separate Requests, Logs and Traces tabs are gone.
- Facets. A sidebar shows value counts for status code, HTTP method, service, log level, span kind and error type. Search it, collapse it, or click a value to filter.
- Tree or list. Switch between a trace tree and a flat list, and flip the sort so the newest events sit at the bottom, like a tail.
- New data. Events that arrive while you watch are marked, and a button scrolls you to the bottom.
- Span details. Attributes show as nested JSON. HTTP, database and RPC attributes, including the database query text, sit in a sticky sidebar, with tabs for the request and response.
- Old and new OpenTelemetry HTTP attribute names are both recognized, and an open trace is kept in the URL.
Issues
- Errors from spans. Exceptions recorded on spans are picked up as errors.
- Grouped notifications. New endpoints or runtime errors found within about five minutes arrive as one Slack, Discord or email message.
- Errors and issues that weren’t showing up now appear.
Dashboards & Metrics
- The Overview and endpoint dashboards read from the new store, including host charts in the API catalog.
Onboarding & Billing
- Retention. Logs and spans are kept for 14 days, up from 3.
- Project settings. A new settings area has pages for members, integrations, billing and deleting a project. It’s linked from the bottom of the sidebar.
- The View logs links on endpoints and hosts in the API catalog work again.