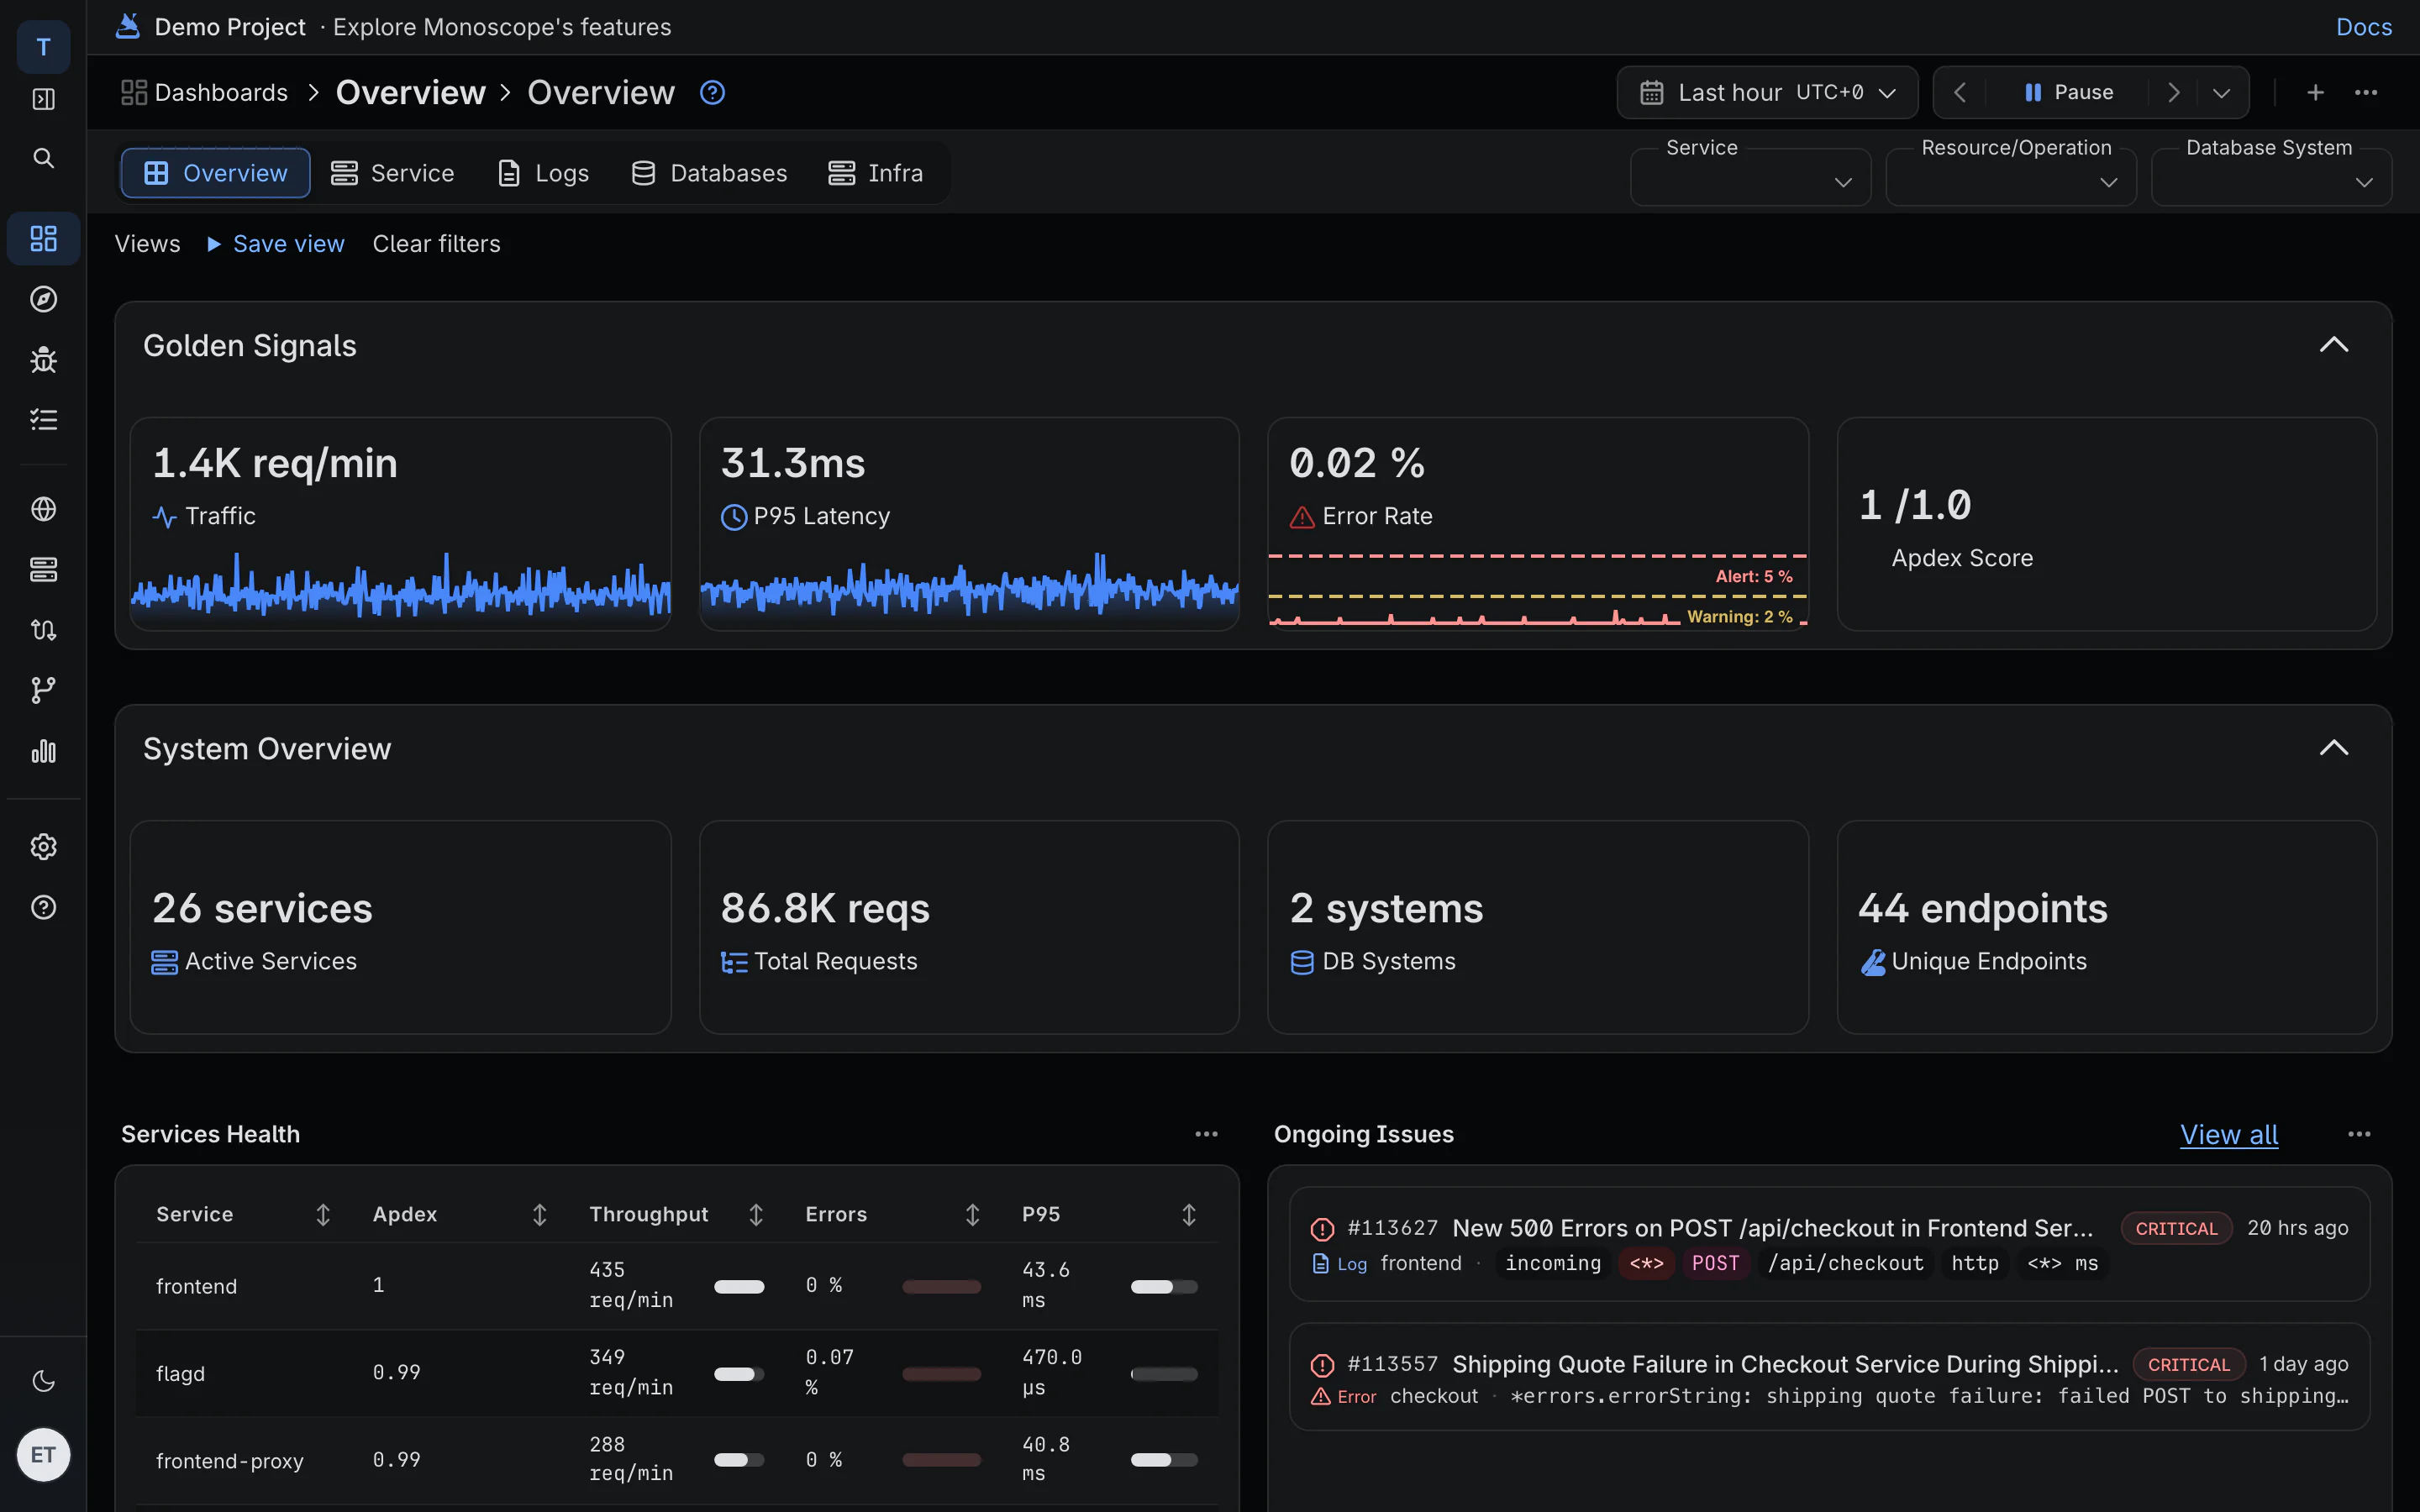
Dashboards & Metrics
- Custom dashboards for everyone. Start from a template (Overview, HTTP stats, Docker or Kubernetes) and find dashboards fast with search in the dashboard list.
- Linked charts. Hover a chart and the tooltip moves on every other chart on the page, so you can line up a latency spike with an error spike.
- Fixes. Opening a custom dashboard no longer crashes, and dashboards on projects with many issues no longer flicker.
Logs & Traces
- A faster list. The log and trace list loads more rows as you scroll and stays fast on large result sets.
- Logs inside traces. A trace now shows its spans and the logs written during it in one list.
- Side panel. Click an event to open its details next to the list. The selected row stays highlighted.
- Share links. Share a single span or log, not only a request. Links expire after 48 hours.
- JSON tools. Expand an event’s JSON, collapse it all at once, or download it.
- More on each span. Database spans show their database attributes. Span duration and service name are available as columns. HTTP spans show request and response bodies, with base64 bodies decoded to JSON.
- Latency percentiles. The explorer charts p50, p75, p90 and p95 latency.
- Fixes. Expanding traces is faster, the flame graph and trace breakdown display correctly, and an empty search shows an empty state instead of a blank list.
Onboarding & Billing
- After you log in, monoscope takes you back to the page you were trying to open.
- Weekly reports are no longer sent for projects with no traffic, and blank reports are fixed.